 Climate Clues In Southern Ocean: Ocean Currents Surprisingly Resistant To Intensifying Winds
ScienceDaily (Dec. 2, 2008) — The Antarctic Circumpolar Current is the current system with the largest volume transport in the world ocean. Between 40° and 60°S strong westerlies move about 140 million cubic meters of water per second around the Antarctic continent (this is about five times the transport of the Gulf Stream).
Vertical motions associated with this current have been responsible for transporting a substantial fraction of the anthropogenic carbon dioxide emissions from the atmosphere to the deep ocean, thereby effectively damping the rate of global warming.
Investigations in this key region of the world ocean have been hampered by a sparse database due to the logistical challenges for ship based expeditions in the high-latitude Southern Ocean.
“In our study we used data obtained by the international Argo Programme”, explains Prof. Claus Böning from the Leibniz Institute of Marine Sciences (IFM-GEOMAR) in Kiel, Germany. Argo is a system of currently 3000 autonomous free-floating robotic systems which are surveying the world ocean. Every 10 days these buoys measure temperature and salinity profiles over the upper 2000 meters. These measurements are transmitted to land stations via satellite. “For this study about 52,000 profiles of more than 600 Argo-drifters in the Southern Ocean were used and compared with historic ship measurements”, explains oceanographer Astrid Dispert from IFM-GEOMAR. For this analysis the extensive archives of the Australian marine research centre in Hobart, Tasmania were also used.
As expected, the observations in the subpolar ocean demonstrate an increase of water temperature and a decrease in salinity at the same time. Nevertheless, in contradiction to the simulations of various climate models the data show no significant changes in water transport. “Our results point to one important thing: Eddies which are currently not resolved in climate models might be the key process in controlling the transport of the ACC”, Prof. Böning explains. Hence, his conclusion is that investigations with high-resolution ocean models are required to test this hypothesis. “Of course, besides the simulations we also need further observations”, adds Prof. Martin Visbeck (IFM-GEOMAR). “Thanks to the international Argo observations programme we now have continuously access to data from a worldwide network of more than 3000 profiling-drifters. This is a quantum leap in the field of ocean observations, which, together with high resolution modelling gives us new insights about long-term changes in the ocean.“
Further investigations have to show whether the results are robust. If confirmed, this would in one way be good news: Until now the Southern Ocean is the biggest oceanic sink for anthropogenic carbon dioxide and therefore a crucial regulator for the atmospheric carbon dioxide concentration. Climate models predicted a severe reduction in the southern ocean carbon dioxide uptake due to wind-forced changes in the current fields. Now high-resolution models are needed to assess the role of the hitherto unresolved ocean eddies in the Southern Ocean’s response to the progressive changes in the atmospheric conditions.
WEATHER NOTEVenice under water
Duckboards and elevated walkways were set up throughout Venice today and elderly residents were carried to dry ground, as the city faced its worst flooding for two decades.

A woman wakls on Piazza San Marco yesterday. Nearly all the streets of the city were underwater. Pic: AFP
As the sea surged into St Mark's Square, arguably Venice's most famous landmark, it became completely submerged under eighty centimetres of water. In total, more than 95% of the rest of central Venice was flooded and some pontoon bridges began floating away in the rising tide, leaving residents stranded in their homes.
Driven by strong winds and heavy rain, the water rose to 156cm above sea level - the highest "acqua alta" since 158cm in 1986. Sirens sounded as the Venice tide monitoring centre warned that the water could rise to over 160 centimetres for the first time in thirty years.
The worst floods took place in 1966 when the waters reached a record 194 centimetres above sea level, causing devastation to homes, shops and historic monuments and art works. Flooding of 100-130cm above sea level is common in the lagoon city in autumn and winter.
As today's floods intensified, workers set up duckboards and elevated walkways as the sirens sounded, and text messages with warnings and updates were sent to those who have registered with the flood warning centre on their mobile phones. Elderly residents were carried to dry ground, and homes and shops activated their ground floor pumps.
The plight of Venetians and visitors was compounded by a national transport strike which affected the Venice "vaporetto" or water bus service.
Giancarlo Galan, head of the Veneto region, said the transport workers had chosen a bad time to strike. "I'd like to give them a medal for their sense of responsibility," Mr Galan said sarcastically.
A floating flood barrier is under construction at three entrances from the Adriatic into the lagoon, but is not due to go into operation until 2012 at the earliest. The authorities are also considering a scheme to raise the city's buildings by up to a metre using piston-supported-poles.
The growing severity and frequency of floods is attributed to silt deposits raising the floor of the lagoon and a rise in sea levels caused by global warming.
However Mr Cacciari played down alarm, saying flooding was part of everyday life in Venice. "We get sea levels of 140m, 160m every few years," the Mayor said. Italian meteorologists said the entire country was being affected by bad weather, with driving rain, snow, hail and high winds causing flooding "from the Alps to Palermo".
Many roads in Piedmont, Liguria and Lombardy were closed, and Rome was hit by hail and rainstorms, with fallen trees blocking roads and cars submerged in flooded road tunnels.
Researchers Use Sun Cycle to Predict Rainfall Fluctuations
(PhysOrg.com) -- The sun’s magnetic field may have a significant impact on weather and climatic parameters in Australia and other countries in the northern and southern hemispheres.
ccording to a study in Geographical Research published by Wiley-Blackwell, the droughts in eastern Australia are related to the solar magnetic phases and not the greenhouse effect.
The study titled “Exploratory Analysis of Similarities in Solar Cycle Magnetic Phases with Southern Oscillation Index Fluctuation in Eastern Australia” uses data from 1876 to the present to examine the correlation between solar cycles and the extreme rainfall in Australia.
It finds that the Southern Oscillation Index (SOI) – the basic tool for forecasting variations in global and oceanic patterns – and rainfall fluctuations recorded over the last decade are similar to those in 1914 -1924.
Author Professor Robert G. V. Baker from the School of Environmental Studies, University of New England, Australia, says, “The interaction between the directionality in the Sun’s and Earth’s magnetic fields, the incidence of ultraviolet radiation over the tropical Pacific, and changes in sea surface temperatures with cloud cover, could contribute to an explanation of substantial changes in the SOI from solar cycle fluctuations. If solar cycles continue to show relational values to climate patterns, there is the potential for more accurate forecasting through to 2010 and possibly beyond.”
The SOI-solar association has been investigated recently due to increasing interest in the relationship between the sun’s cycles and the climate. The solar application offers the potential for the long-range prediction of SOI behavior and associated rainfall variations, since quasi-periodicity in solar activity results in an expected cycle of situations and phases that are not random events.
Professor Baker adds, “This discovery could substantially advance forecasting from months to decades. It should result in much better long-term management of agricultural production and water resources, in areas where rainfall is correlated to SOI and El Niño (ENSO) events.”
This paper is published in the December 2008 issue of Geographical Research Vol. 46 Issue 4. (Report)
MARITIME NOTE
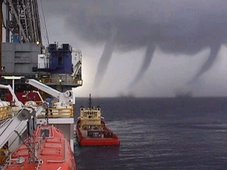
Science Speaks: Rogue Waves are Real
 |
| 'Rogue wave approaching on ship Nathaniel B Palmer' . |
In the past, some scientists wrote off 'rogue waves' as rare or even mythology.
 |
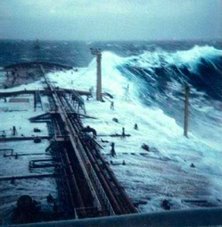
Rogue waves on NOAA ship Discoverer in the Bering Sea - .. . |
The Norwegian Dawn, a 965-foot ocean liner , was sailing back to New York from the Bahamas on April 16 2005 when it was struck by a rogue 70-foot wave. The wave smashed windows and sent furniture flying, but the ship survived and the crew lived to record the wave's arrival.
A sailing boat faced with such a wave would have little chance of survival, and if it came at night, maybe not even the chance to hit the EPIRB.
A giant wave can form when strong winds beat against an opposing ocean current, when waves from different storms join forces, or when swells interact in strange ways with a particular seafloor.
 |
Wave Height Predictions off the coast of Massachusetts - .. . Click Here to view large photo |
A buoy off the coast of Alabama recently recorded an average wave height of 16 meters before the gauge broke, Panchang said. Since that figure is just an average of measurement of a sea-state, the biggest wave at that location was probably twice that size--32 meters, or about 100 feet.
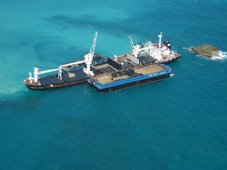
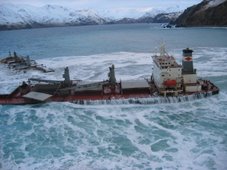
'There were oil platforms destroyed,' said Panchang, who requires his wave mechanics students to read The Perfect Storm. 'The sheer magnitude of these things amazes me.'
Severe weather has sunk more than 200 supertankers and container ships more than 200 yards long in the past two decades, an ESA analysis found.
Counting waves from space:
The two ERS satellites equipped with radar carry out a global rogue wave census and arrive at the truth.
Without aerial, cloud-penetrating radar, scientists could only go on radar data on waves collected from oil platforms.
The radar instruments on the satellites detected the height of individual waves at the surface in 3-mile by 6-mile patches of the sea. Three weeks of data, including 30,000 of these patches or 'imagettes' of the sea with their wave height information were analyzed and searched for extreme waves at the German Aerospace Center.
A scientific team counted more than ten individual giant waves around the globe more than 75 feet high during the three-week period.
What can the cruising sailor do?
 |
Rogue wave approaching in the Bay of Biscay Fall 1993 - NOAA - .. . |
If there are different swells meeting, the other most obvious rule is to stay away from underwater mountains and ranges, where rogue waves are likely to develop if other conditions accumulate. There are many examples of underwater disturbances on the world's charts, eg. between Madeira and the Canary Islands, between Sydney and Lord Howe Island, and between Palmerston Atoll and Tonga.
Another underwater feature to be avoided is the underwater cliff, which often occurs close to coastlines. One of the most notorious of these is in the Bay of Biscay, where the depth changes from thousands of meters to a few hundred in a short distance.
To find examples of Vijay Panchang's wave predictions, which do not exist for all parts of the world, click here
RS


![[Valid RSS]](valid-rss.png "Validate my RSS feed")