@teamrobinstorm

We are pleased to announce that Robin Storm is now a NOAA Weather-Ready Nation Ambassador™ !!!!!
Welcome to the NOAA Weather-Ready Nation Ambassador™ initiative. Your organization has been accepted as a NOAA Weather-Ready Nation Ambassador .

Two University of Iowa researchers recently tested the ability of the world's most advanced weather forecasting models to predict the Sept. 9-16, 2013 extreme rainfall that caused severe flooding in Boulder, Colo.
The results, published in the December 2013 issue of the journal Geophysical Research Letters, indicated the forecasting models generally performed well, but also left room for improvement.
David Lavers and Gabriele Villarini, researchers at IIHR -- Hydroscience and Engineering, a UI research facility, evaluated rainfall forecasts from eight different global numerical weather prediction (NWP) models.
During September 2013, Boulder County and surrounding areas experienced severe flooding and heavy rain resulting in fatalities, the loss of homes and businesses, and the declaration of a major disaster.
After the storms had subsided, Lavers and Villarini decided to examine how well some of the leading NWP models had done. As a constantly improving science, NWP involves integrating current weather conditions through mathematical models of the atmosphere-ocean system to forecast future weather. For their study, the researchers selected the actual rainfall forecasts made by eight state-of-the-art global NWP models for the period of the Colorado floods.
Read > Best weather forecasting models evaluated: Which one best predicted September 2013 Colorado floods?

Climate researchers have made the world's temperature records available via Google Earth. The new Google Earth format allows users to scroll around the world, zoom in on 6,000 weather stations, and view monthly, seasonal and annual temperature data more easily than ever before. The move is part of an ongoing effort to make data about past climate and climate change as accessible and transparent as possible.

The number of annual excess deaths caused by hot weather in England and Wales is projected to surge by 257% by the middle of the century, as a result of climate change and population growth, concludes research published online in the Journal of Epidemiology and Community Health.
The elderly (75+) will be most at risk, particularly in the South and the Midlands, the findings suggest.
The research team, from the London School of Hygiene and Tropical Medicine, and Public Health England, used time-series regression analysis to chart historic (1993-2006) fluctuations in weather patterns and death rates to characterise the associations between temperature and mortality, by region and by age group.
They then applied these to projected population increases and local climate to estimate the future number of deaths likely to be caused by temperature -- hot and cold -- for the 2020s, 2050s, and 2080s.
They based their calculations on the projected daily average temperatures for 2000-09, 2020-29, 2050-59 and 2080-89, derived from the British Atmospheric Data Centre (BADC), and population growth estimates from the Office of National Statistics.
Read > http://www.sciencedaily.com/releases/2014/02/140203191806.htm?utm_source=feedburner&utm_medium=email&utm_campaign=Feed%3A+sciencedaily%2Fearth_climate+%28Earth+%26+Climate+News+--+ScienceDaily%29

 LEO-15 Undersea Node
Rutgers University has two unmanned undersea research nodes that are deployed 9 kilometers off the coast of Brigintinne, New Jersey. These two nodes are part of a research site called LEO-15.
They are linked to the Rutgers Marine Field Station in Tuckerton, NJ, with an electro-optic cable that contains optical fibers to transfer information and copper wires to transfer power. This link provides a real-time connection between the undersea world off the coast of New Jersey and the Internet, providing scientists, engineers, and educators with realtime access to the sea. It permits them to monitor experiments and to alter their direction from essentially any classroom, office building, or laboratory in the world. The cable also provides continuous and ample electrical power, a luxury denied to experimentalists using traditional methods to study the ocean.
The LEO-15 Concept

National Severe Storms Laboratory Chief of Forecast Research and Development Dr. David Stensrud discusses severe weather modeling and improving forecasts of severe weather events. Recorded 8 November 2007

March - DART buoy network expansion complete! NDBC deployed a new water level measuring buoy in the Pacific. This completes the planned expansion of the NOAA tsunami reporting network and brings the total number of DART stations to 39.
February - DART buoy network expanded. NDBC deployed four new DART buoys in the Pacific. This brings the total number of DART water level measuring stations in the NOAA tsunami reporting network to 38.
January - Waves/ocean buoy at Buzzards Bay! NDBC established WAMDAS buoy 44070 and added it to the Rhode Island map.
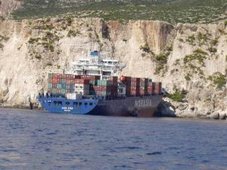
The future of the stricken Riverdance ferry will be decided during crisis talks on Thursday.
Salvors, insurers and the boat's owners will meet to discuss what to do next, after the vessel was battered by further bad weather.
The ferry is now completely on its side and is sinking into the sand, and salvors have admitted that cutting the boat up on the sand is a possibilty, but still a last resort.
But it is starting to look like the most likely option, after attempts to salvage the boat over the last month have failed.
NOAA – CAMEO proposalsThe National Oceanic and Atmospheric Administration (NOAA) issued a notice stating that it is soliciting proposals to strengthen the scientific basis for the Comparative Analysis of Marine Ecosystem Organization (CAMEO) program. The CAMEO program assists policy makers and resource managers to make ecosystem-science-based decisions that fulfill policy goals and management objectives of society. Proposals must be received no later than June 17. 73 Fed. Reg. 14774 (March 19, 2008).
 A while back storm spotters and chasers had a discussion on the Theta-E Parameter.
A relationship between a surface theta-e ridge and dominant lightning polarity
Nettie R. Lake, Lyndon State College, Lyndonville, VT; and D. R. MacGorman
For many years, it was believed that cloud-to-ground lightning lowered only negative charge to the ground (-CG flashes). In the past twenty years, however, flashes lowering positive charge (+CG flashes) have been documented and studied. This presentation summarizes positive correlations between +CG flashes, hail, and tornadoes.
Recent studies have reported that in some cases, dominant storm polarity reverses from positive to negative. Additionally, it has been observed that 50% of such storms are tornadic, and that tornadoes usually occur during or after the reversal. Smith et al. (2000) observed that polarity reversals often occur at surface equivalent potential temperature (theta-e) ridges. This study examined dominant polarity patterns of severe storms during the entire year 1999. Similar to Smith et al. (2000), this study found that 82% of polarity reversals occur at a theta-e ridge.
Furthermore, positively dominated storms that move parallel to a ridge axis seldom reverse polarity. Also, negative storms do not reverse polarity relative to a theta-e ridge. Explanations for why polarity reversals may occur at a theta-e ridge will also be discussed.
CASE STUDY - 2A new index to assess the potential and severity of wet microbursts is currently under development. The index, designated as the Wet Microburst Severity Index (WMSI), accounts for the physical processes of convective storm development and downburst generation by incorporating such parameters as convective available potential energy (CAPE), to represent the process of updraft formation, and Theta-e Deficit (TeD), to represent downburst development.
Since convective storm updrafts require buoyant energy, a very important parameter used in the analysis of convection is CAPE, which is easily computed from Geostationary Operational Environmental Satellite (GOES) sounding data. Since updraft strength is proportional to CAPE, large CAPE would result in strong updrafts that could lift the precipitation core within a convective storm to the mid-level dry air layer. CAPE also plays a major role in the formation of precipitation.
The strong updrafts resulting from large CAPE will increase the size of precipitation particles, which, in turn, will then enhance the effect of precipitation loading. The amount of mid-level water vapor relative to the low-level water vapor in the atmosphere as indicated by a sounding profile is important in the determination of the strength of downdrafts that occur in convective storms. This condition is modeled by the Theta-e Deficit (TeD), represented by the algorithm TeD = theta-emax - theta-emin, where (theta-emax) refers to the maximum value of theta-e at the surface and (theta-emin) refers to the minimum value of theta-e in the mid-levels of the troposphere.
TeD serves as an important indicator of the difference in water vapor concentration (plus thermal energy cpT) between the surface and mid-levels. Large TeD values imply the presence of relatively dry air at mid levels that will result in evaporative cooling and the generation of large negative buoyancy as the dry air is entrained into the convection cell. The WMSI algorithm is given as the following expression: WMSI = (CAPE)(theta-emax - theta-emin)/1000.
CASR STUDY - 3Maya Bell
Sentinel Staff Writer
February 14, 2008
Exactly how and why that happens may become a bit clearer one day, thanks to new undersea sensors Shell Oil Co. has agreed to install on one of its oil platforms in the Gulf south of New Orleans.
Known as "thermistors," the instruments will measure heat content of the water to a depth of 100 meters, or about 330 feet, and may be operable by this fall, in time for the peak of the 2008 hurricane season. The data could help hurricane scientists measure the effects of warmer water on storm intensity.
They are one piece of a nearly $1 million investment the oil company is making to collect data for hurricane research, forecasting and coastal-resource management.
Marking the first private-public partnership of its kind, Shell has agreed to acquire and install weather and oceanic data-collecting sensors on seven of its oil and gas facilities in deep waters off the Gulf Coast from
The
"This is very significant," said
Under federal law, 59 deep-water gas and oil platforms operating in the Gulf already are required to collect and transmit observations of ocean currents to NOAA's National Data Buoy Center. But the agreement between NOAA and Shell, forged after NOAA administrator Conrad Lautenbacher and Shell President John Hofmeister met at a 2006 summit on the Gulf and discussed how their organizations could leverage their strengths, goes much further.
In addition to the ocean heat sensors, by next spring Shell will install transmitters, complete with battery-backup power, on four platforms that will send sea-surface and air temperatures, pressure and wind speed to NOAA's geostationary satellites -- even if the platforms are evacuated because of a hurricane. Tethered to the sea bottom by cables, the platforms can twist in a figure eight to withstand storm-force currents and winds.
Shell also has agreed to collect and share meteorological data from two Continental Shelf locations off
Because
"Think about it: More than half of Florida's real estate is on the Gulf of Mexico," said hurricane-center spokesman Dennis Feltgen. "And storms don't always move west. Sometimes they come from the west. Remember Wilma," a reference to the 2005 late-season storm that swept across southwest
While Shell spokeswoman Darci Sinclair said the thermal sensors should help hurricane forecasters improve on their weakest skill -- predicting the intensity of storms -- forecasters said the data will likely be of more use to researchers. But they'll be glad to have it.
"Every meteorologist always wants every bit of data he or she can get," hurricane specialist James Franklin said.
Maya Bell can be reached at mayabell@orlandosentinel.com or 305-810-5003.
GROUNDED cargo ship, the Riverdance, is expected to set sail this week - and it couldn't come quick enough for local residents.
Locals living in the English holiday town of Blackpool have experienced the same tourism fever Newcastle locals had when the Pasha Bulker ran aground last year.
Blackpool's promenade has become a "nightmare" with locals complaining of traffic jams as people across England travel to see the Riverdance, an Irish-owned ship which has been grounded for 17 days.
"When it first happened it took me 45 minutes to get down the road to get home. The parking is a nightmare too," Blackpool local Steven Wilkinson said.
"It'll be worse this week with half term holidays. You can't blame people for coming to see the ferry though. It's a one off and their kids want to see it."
It's not only the locals who are complaining. Sightseers say they are finding it difficult to park in the small seaside town.
"I've come every day to see the ferry. It's jolly good to see so many people here. But there are a lot of cars. People living here know where to go for parking spaces, but visitors wouldn't know where to park. There aren't enough spaces," visitor Clarice Dale told the Blackpool Gazette.
Small business owners will be sad to see the Riverdance go.
"Our business has doubled. The longer it's here, the better it is for us. It's been great for business, you don't need to advertise the area - just put a boat on the beach! " Ann Wilkinson, owner of Blackpool's The Eating House said.
 ScienceDaily (Jan. 26, 2008) — Ocean surface currents have long been the focus of research due to the role they play in weather, climate and transportation of pollutants, yet essential aspects of these currents remain unknown.
 By employing a new technique – based on the same principle as police speed-measuring radar guns – to satellite radar data, scientists can now obtain information necessary to understand better the strength and variability of surface current regimes and their relevance for climate change.
Scientists at the SeaSAR 2008 workshop held this week in ESRIN, ESA's European Centre for Earth Observation in Frascati, Italy, demonstrated how this new method on data from the Advanced Synthetic Aperture Radar (ASAR) instrument aboard ESA’s Envisat, enabled measurements of the speed of the moving ocean surface.
Synthetic Aperture Radar (SAR) instruments, such as ASAR, record microwave radar backscatter in order to identify roughness patterns, which are linked to varying surface winds, waves and currents of the ocean surface. However, interpreting radar images to identify and quantify surface currents had proven very difficult.
By using the new information embedded in the radar signal – the Doppler shift of the electromagnetic waves reflected from the water surface – Dr Bertrand Chapron of the French Research Institute for Exploitation of the Sea (IFREMER), Dr Johnny Johannessen of Norway’s Nansen Environmental and Remote Sensing Centre (NERSC) and Dr Fabrice Collard of France's BOOST Technologies were able to determine how surface winds and currents contribute to the Doppler shift.
The Doppler shift occurs due to changing relative velocities, experienced in everyday life in the way the pitch of a siren on a passing ambulance goes up as it approaches, then goes down as the vehicle recedes away.
The shift is introduced by the relative motion between the satellite platform, the rotation of the Earth and the velocity of the particular facets of the sea surface from which the SAR signal scatters back to orbit. The initial two values are well known – particularly for Envisat, with its very stable satellite orbit and attitude – and can be simply subtracted to extract the useful sea surface velocity information.
Chapron first demonstrated the concept in 2005 with initial tests carried out over the Gulf Stream. Although the results were promising, repeat acquisitions and careful validation were not possible. However, based on these conclusions ESA upgraded its ASAR ground segment in July 2007 to systematically process and disseminate a Doppler grid product, a regularly spaced collection of individual Doppler information, for all Wide Swath acquired images.
The Doppler grid, embedded in ESA standard products, is now regularly tested on a number of so-called super-sites, including regions of the Gulf Stream and the greater Agulhas Current, both among the strongest western boundary currents of the world’s oceans.
"These measurements are very useful for advancing the understanding of surface current dynamics and mesoscale variability, as well as for determining surface drift, important for oil dispersion and pollution transport and for wave-current interaction, probably influencing the existence of extreme waves," Johannessen said.
"The method at this very high resolution could also complement the use of additional information sources to improve 3-D ocean models. Its use for sensor synergy with radiometry, spectrometry and altimetry is very promising," Chapron added.
The ground segment upgrade is also allowing the scientists to examine the anticipated Doppler shift signal of the river outflow at the mouth of the Amazon delta to monitor river runoff and improve our understanding of hydrological processes.
Chapron and Collard also presented their Near Real Time global swell wave observations to the workshop, attended by 150 participants from 25 countries. Using standard processed SAR ESA wave mode products, the team produces three hourly animations every morning for the Atlantic, Pacific and Indian Oceans and makes them available online.
Tracking swell waves from space is very important because they are generally preceded by calm water, making it impossible to detect their arrival from shore. Envisat’s Wave Mode acquires 10 by 5 km small images, or 'imagettes', of the sea surface every 100 km along the satellite orbit. These small images, which depict the wave groups, are then mathematically transformed into wave energy and direction, called ocean-wave spectra.
ESA has provided SAR data to some 500 oceanography projects since 1998 and remains committed to providing continuity to its SAR missions. As part of its Global Monitoring for Environment and Security (GMES) programme, the agency will launch the Sentinels – the first series of operational satellites responding to the Earth Observation needs of GMES, a joint initiative of the European Commission and ESA.
Sentinel-1, expected to be launched in 2011, will ensure the continuity of C-band SAR data with ESA's ERS-2 and Envisat satellites. Important applications driving the mission concept include marine - vessel detection, oil spill mapping and sea ice mapping. With these new findings, Sentinel-1 is expected to provide additional information, such as consistent wind, wave and current products.
Adapted from materials provided by European Space Agency.
NOAA DATABASE SUMMARY  |
  |
The US Coast Guard issued a press release announcing the availability of the Incident Specific Preparedness Review (ISPR) report on the response to the oil spill from the M/V COSCO BUSAN in San Francisco Bay on 7 November 2007. The report did not examine the causes of the spill, only the response thereto.
The major areas for improvement identified in the report include having more experienced personnel on duty or on standby; prompt communication with local officials and the public; and improved planning for training and utilization of volunteers offering assistance in the response effort. The report found that the actual response effort in this spill was quite good, but that the initial investigation and external relations were lacking.
The Coast Guard also published a Timeline showing the various notifications and response actions, as well as a Hindcast, showing the estimated movement of the spilled oil through San Francisco Bay and adjacent waters in the hours after the spill. Finally, the Coast Guard released a PowerPoint document that walks through some of the major points of the ISPR. (1/28/08)
Hole found in storm ship's side

"David Westerholm is an innovative and proven leader who has more than 30 years' experience heading and managing environmental, safety, security, and engineering programs," said John H. Dunnigan, NOAA assistant administrator for the National Ocean Service. "His expertise in preparing for and responding to oil spills and the release of hazardous materials will enhance NOAA's already strong response capabilities."
Before joining NOAA, Westerholm was VP and senior operations director for maritime security, policy, and communications with General Dynamics Information Technology, where he managed $17 million in contracts supporting federal and state customers in homeland security, emergency response, and strategic communications. While serving as a Coast Guard officer from 1976 to 2003, he worked in marine safety, homeland security, environmental compliance, and emergency planning and response roles. He has a master of science degree in environmental policy and planning from the University of Michigan.
 Well 2008 arrived and so did the snow!
| Wind Speed: | 14.42 kts (7.42 m/s) |
| Max Wind Speed: | 17.90 kts (9.21 m/s) |
| Wind Direction: | 283° (WNW) |
| Air Temperature: | 8.2 °F (-13.2 °C) |
| Wind Chill: | -9.7 °F (-23.2 °C) |


 Container ship runs aground in English channel
 Wed Jan 2, 6:38 AM ET
A large container ship ran aground in the English Channel south of Dover on Wednesday, but all on board were safe and there were no reports of pollution, coastguards said.
The German-registered "LT Cortesia" became stuck on the Varne-bank, a large underwater sand bank about nine miles south of the port, said the Maritime and Coastguard Agency.
The 90,000-tonne vessel was travelling from the Thames estuary westbound towards the Atlantic Ocean when it ran aground around 5:00 am, it said in a statement.
"The vessel has 27 people on board who are all uninjured. Crew members are checking for damage on board but the cargo is reported to be secure and early indications are that the vessel is watertight," said the agency.
The English Channel is among the busiest shipping lanes in the world, and the stretch near Dover is its narrowest point, where traffic from the North Sea and the Atlantic squeezes through between England and France.
There was no reported pollution from the stricken vessel, the English coastguard adding that an emergency tug, the "Anglian Monarch," was on the scene to assess the damage and possibilities for salvaging the ship.
"Dover Coastguard and the Anglian Monarch will warn any approaching vessels of the potential navigation hazard posed by the LT Cortesia while she is aground," it said.
The container ship is carrying 42,785 tonnes of cargo, the agency added.
Efforts to pull the ship off of the underwater sandbank were initially working against a falling tide. The next high water was expected by early evening, around 1830 GMT.
Winds on the scene were reported as Force 4, a light breeze during the morning, but were expected to strengthen with gale-force winds possible later in the day, coastguards said.
 |
It seems that some folks are seldom at a loss for predicting what kind of winter we’ll have this year. There are predictions galore, very few of which have any scientific basis.
Winter’s official beginning is the winter solstice, Dec. 21, although for seasonal matters we usually consider winter to begin Dec. 1. It is always interesting to hear what prognosticators have to say about what we’re to expect the coming year.
Your writer doesn’t usually make predictions of this kind, although I would give very high odds against this winter being as severe as the winters of 1977-78, which were two of the coldest, snowiest winters on record since World War II. Likewise, I would go on record in predicting the weather to be changeable (isn’t it always around here?) and characterized by fluctuating warm spells and cold spells. The question is, “Will there be more cold spells than warm spells, and how cold will the cold spells get?” Most folks simply want to know, “Will the winter be severe or mild?” Your writer is leaning more toward mild (or something in between).
However, not everyone expects the next three months to be mild. A substantial number of people depend upon the wooly worm for their predictions, and this year the wooly worm predicts a rough winter. A wooly worm is that fuzzy little critter you may have seen several weeks ago crawling over rural roads and across walks, lawns and fields in search of a protected place to spend the winter. The wooly worm is not really a worm but a caterpillar (see photo). Its coloration is orange and black, with each color present in varying amounts. The orange supposedly represents mildness and the black indicates severe weather. This year, there was more black than orange. Some supporters go so far as predicting specifically for weeks of early winter, weeks of mid winter, and weeks of late winter. For example, a caterpillar with black at the ends but orange in the middle would indicate rough early and late winter but mild midwinter. The caterpillar is the larval stage of the Isabella tiger moth (see photo). The larva has 13 segments to its body, and supporters of the wooly worm theory point out that there are 13 weeks of winter.
Scientists fail to see how the color of the moth caterpillar would have any relationship to weather. Yet there are many dedicated worm watchers. Indeed, at Banner Elk in the mountains of northwest North Carolina a Wooly Worm Festival is held annually.
There are other clues in nature that provide some outdoorsmen with ideas about the severity of winter weather. One of the more common indicators is the thickness of fur in our fur-bearing mammals. By carefully observing the pelts of animals in late November through early December, one supposedly can gain some indication of the upcoming winter weather. If the fur of an animal such as a raccoon (see photo) is carefully observed, and it appears thicker and heavier than usual, supporters of this idea swear that this means a severe winter. A raccoon can be accessible in view of the large road-kill number. Of course, coon hunters also can provide this kind of data. There would appear to be some logic associated with this idea, but there are other variables that can bear upon fur growth such as disease, nutrition, etc. For what it’s worth, my observations indicate that fur this year is not especially thick.
Yet another indicator for some observers is the activity of ground squirrels in gathering and hoarding mast (nuts, acorns). When squirrels such as the gray squirrel (see photo) appear to be busier than usual in carrying and storing these food items, it is taken for an indicator of a severe winter. Again, your writer has not noticed more than the usual amount (if even as much) of this activity during previous weeks.
Of course, there are those that look to the Old Farmer’s Almanac for predictions about the upcoming year. It predicts a very warm 2008 overall. As far as the winter itself, it predicts a slightly warmer but wetter one. The Old Farmer’s Almanac holds a fairly good record on predictions. However, they do not reveal their methods at arriving at their predictions. Meteorologists tend to shy away from long-range predictions, although some of them tend to postulate some probability of a warmer, wetter winter. Some of this could be based upon the global warming trend which is a reality. Long-range predicting all comes down to probabilities. Such an approach is much more scientific than wooly worms or the idea that extremely cold winters always follow extremely hot summers.
And then there is this from Contra Costa Times.com
That's because this month, NASA contracted with a Palo Alto firm to build the first lightning mapper satellite.
"We'll be able to say 'This is a bad time to be out playing golf,'" said project manager Joe Mobilia at Lockheed Martin's Space Systems Advanced Technology Center
More important, the instrument may be able to increase the warning time for tornadoes from 12 to 20 minutes, he said.
"Lightning is a precursor to tornadoes," Mobilia said.
Aboard a National Oceanic and Atmospheric Administration environmental satellite, which provides most satellite weather images, the instrument will monitor lightning between clouds and detect flashes in areas missed by equipment on the ground, Mobilia said.
The significance of the $96.7 million project is that it will give forecasters a "real-time assessment of all lightning activity," said John Leslie, spokesman for the NOAA.
"It will also give a more accurate picture of how intense a particular storm is becoming and help detect the onset of tornadoes," Leslie said.
Simply monitoring lightning activity likely will help save lives, Mobilia said.
"What people generally don't realize is there are statistically more deaths from lightning than there are from tornadoes," he said.
In the past 30 years, lightning has caused an average of 62 reporteddeaths each year, according to the National Weather Service, and tornadoes, on average, have killed 45 people annually in the past three years, according to the National Climatic Data Center
Mobilia's team in Palo Alto, working with researchers at the University of Alabama at Huntsville, hopes to launch the desk-sized device by 2014.
Among the challenges of designing a lightning mapper is being able to measure flashes during both day and night, Mobilia said.
"At night you can see the flashes, but during the day we have to distinguish that from normal sunlight bouncing off the clouds," he said. The instrument, which will be designed and built in Palo Alto, will rely on data gleaned from a series of initial flashes to determine whether lightning is occurring, he said.
When it launches around December 2014, the lightning mapper likely will be joined by a solar ultraviolet imager -- a $178 million NASA contract awarded to the Palo Alto group this fall.
Installed on the same series of satellites -- one above the East Coast and one above the West Coast -- the solar telescope will monitor the sun's activity to predict solar flares, which can overload power grids and cause transformers to explode, said project manager Mons Morrison.
Both instruments will be built to survive extreme temperatures in space for at least 15 years.
Reach Kristina Peterson at kpeterson@dailynewsgroup.com
To view Illinois Emergency Management Agency’s Winter Storm Preparedness Guidebook, click here.
To view the Indiana Winter Weather Preparedness Newsletter, click here.
National Weather Service, Chicago has a winter weather page with lots of information. Go to our web page, weather.gov/chciago, from the main menu on the left, under "Weather Safety", click on "Winter Weather". On our winter weather page you will find links to snowfall reports, snowfall records for Chicago and Rockford, historic snow storms, links to state road conditions, a wind chill chart and calculator, winter weather terminology and warning criteria, and more!
Winter Weather Safety Rules

 EC unveils new EU maritime policy
"At the European level, it is clear the transnational character of maritime affairs demands a European approach: shipping and traffic corridors cross the waters of our Member States, oil spills and pollution know no borders in Europe's waters and illegal activities … are transnational by nature, affecting all of Europe."
 |
| ||
Prestige oil spill |
Under the European Space Policy, ESA is responsible for implementing space capabilities that respond to EU policy needs. The Integrated Maritime Policy will facilitate efficient exploitation of space systems in the maritime sector, which ESA has been actively involved in over the last 25 years.
Because both ERS-1 and ERS-2 significantly exceeded their original design lifetime of three years, it was possible to build an extended, continuous and homogeneous time series of oceanographic measurements, which were not previously possible.
| | ||
Sea surface temperature map |
In addition, satellite data from the radar altimeters onboard ESA’s ERS-1, ERS-2 and Envisat and NASA/CNES’ Topex-Poseidon detected a trend in sea level rise between 2.64 and 3.29 mm/year over the last 15 years.
In 2002, the newly launched Envisat acquired images of the Prestige oil spill in Spain with its Advanced Synthetic Aperture Radar (ASAR) instrument. Since this time, ESA has been working within the Global Monitoring for Environment and Security (GMES) Services Element to demonstrate and qualify the capacity for pan-European oil spill surveillance. Last year, an operational satellite-based oil slick detection service based on SAR data from Envisat and the Canadian Radarsat satellite was set up for all European waters under the European Maritime Safety Agency (EMSA). The service, named CleanSeaNet, is the first operational pan-European satellite based surveillance service for European waters.
|
| ||
CleanSeaNet service |
"This is a first, and significant, step in the process whereby EMSA assists Member States and the Commission in detecting illegal and accidental discharges at sea," Willem de Ruiter, Executive Director of EMSA said.
Intentional and accidental discharges threaten fragile coastal ecosystems, impact on tourism and generate significant clean-up costs. The European policy goal, as stated in the Marine Thematic Strategy of the 6th Environment Action Plan is a complete elimination of discharges into the marine environment by 2020. Effective surveillance such as CleanSeaNet is essential if this objective is to be met. However, oil spill detection is not the only area where satellite based SAR surveillance is being applied.
There is growing interest in the use of satellite SAR for fisheries and for maritime border control. In particular, the Integrated Surveillance System for Europe’s southern maritime borders as requested by the European Council is intending to integrate satellite based surveillance with conventional vessel tracking systems.
| | ||
Chlorophyll-a concentrations in the Dutch coast |
Due to the extensive winter transport levels in the Baltic Sea, Europe hosts the largest volume of commercial shipping activity in ice-infested areas. The timely delivery of accurate, up-to-date sea ice information by national ice services is critical in maintaining the security and efficiency of this transportation. Many national ice services have routinely integrated Envisat and Radarsat SAR imagery into their operational sea ice charts for several years.
These capabilities are based on EO satellites that have already been operating for some time. ESA is working to ensure continuity of the key data streams underpinning these services within the framework of GMES. The Sentinel missions will ensure that SAR, ocean colour, radar altimeter and sea surface temperature observations will be continued beyond the lifetime of the current missions. In addition, ESA is working with the European scientific community to bring new observation techniques, the so called Earth Explorers, to support research in critical Earth science issues such as global change and biodiversity.
ESA welcomes the Integrated Maritime Policy and intends to work with the different actors involved in areas where it sees current or potential future demand for space-based capabilities in the maritime sector.
Hindu Times Special Correspondent| It will take 30 minutes to analyse the seismic data following an earthquake of more than magnitude 6 |

HYDERABAD: A state-of-the-art National Tsunami Early Warning Centre, which has the capability to detect earthquakes of more than 6 magnitude in the Indian Ocean was inaugurated here on Monday by Union Minister for Science & Technology Kapil Sibal. He asked experts to improve the system and further reduce the time for disseminating information to the targeted people.
Lauding various agencies involved in establishing the Rs. 125-crore tsunami warning system without time and cost overruns, he said it was the most modern one in the world. It would now take 30 minutes to analyse the seismic data following an earthquake. The next task was to reduce the time to six to seven minutes, he said. The Centre was set up by the Ministry of Earth Sciences in the Indian National Centre for Ocean Information Services (INCOIS) here.
Mr. Sibal later announced that two more centres of excellence — Joint Marine Meteorological Organisation and Operational Oceanography — would be set up on the INCOIS campus after Chief Minister Y.S. Rajasekhara Reddy instantly agreed to allot 10 acres to the institution.
He said a system was being put in place for collaborating with all neighbouring countries for sharing data. He said four Bottom Pressure Recorders (BPRs) were now deployed in the Bay of Bengal, two in the Arabian Sea and another six would be installed in five to six months. He stressed that technology must be used to provide information to the people through SMS in the local languages.
Real-time networkAccording to an INCOIS release, the warning system comprises a real-time network of seismic stations, BPRs and 30 tide gauges to detect tsunamigenic earthquakes and monitor tsunamis. The tsumanigenic zones that threaten the Indian Ocean were identified by considering past tsunamis, earthquakes, their magnitudes, and the location of the area relative to a fault and also by tsunami modelling.
The east and west coasts of India and the island regions are likely to be affected by tsunamis generated by earthquakes from two potential sources — the Andaman-Nicobar Sumatra island arc and the Makran subduction zone, north of the Arabian Sea.
Integrated Coastal and Marine Area Management (ICMAM) customised and ran the tsunami model for five ‘historical earthquakes’ and predicted inundation areas. The inundated areas are being overlaid on cadastral level maps of 1:5,000 scale. These community-level inundation maps are extremely useful for assessing the population and infrastructure at risk, the release added. Apart from Dr. Reddy, P.S. Goel, Secretary, Ministry of Earth Sciences, Peter Koltermann, Head, Tsunami Unit, Inter-governmental Oceanographic Commission, and Shailesh Nayak director, INCOIS, spoke.
The Senate Committee on Homeland Security and Government Affairs conducted an oversight hearing on Implementation of the SAFE Ports Act. The Act assigned approximately 100 maritime security tasks. Mr. Stewart Baker, Department of Homeland Security (DHS), testified that the Department has completed half of the assigned tasks and is on track to complete most of the remainder within the statutory timeframe. He specifically cited the Secure Freight Initiative (SFI), Long-Range Tracking and Identification (LRIT), and Transportation Worker Identification Credential (TWIC) programs as high priority. He also discussed the gap between the pace of technology and the legislative mandates. Mr. Reginald Lloyd, Department of Justice, testified that Project Seahawk in the Port of Charleston has successfully integrated work of the various federal, state, and local agencies. Mr. Stephen Caldwell, Government Accountability Office (GAO), testified that the Department has made significant progress in enhancing maritime security, but that challenges remain, particularly with regard to meeting statutory deadlines. Captain Jeffrey Monroe, City of Portland, Maine, testified that increased emphasis is needed with regard to cargo security. (10/16/07).
Senate hearing on implementing 9/11 Commission recommendations
The Senate Committee on Commerce, Science, and Transportation conducted an oversight hearing on Implementation of the 9/11 Commission Recommendations Act. The focus of this hearing was security in the aviation and surface transportation sectors. Mr. Edmund "Kip" Hawley, Transportation Security Administration (TSA), testified that drafting and implementing regulations is time-consuming. The Department utilizes risk management principles in its security programs, focusing on high-threat, high-consequence events. He mentioned that the TWIC rollout has commenced. Ms. Cathleen Berrick, Government Accountability Office (GAO), testified that the Department has made significant progress in its transportation security efforts, but that many challenges remain. The GAO strongly endorses use of risk management principles with regard to transportation security. (10/16/07).
Weather NoteRS


 `
`


 `
`








|


This site owned by Robin Storm at Robin Storm. |


![[Valid RSS]](valid-rss.png "Validate my RSS feed")


 Extended Abstract (68K)


