Showing posts with label casualty. ships. Show all posts

Thursday, January 22, 2009

Hazards Of Severe Space Weather Revealed

Hazards Of Severe Space Weather Revealed

ScienceDaily (Jan. 12, 2009) — A NASA-funded study describes how extreme solar eruptions could have severe consequences for communications, power grids and other technology on Earth.

The National Academy of Sciences in Washington conducted the study.

The resulting report provides some of the first clear economic data that effectively quantifies today's risk of extreme conditions in space driven by magnetic activity on the sun and disturbances in the near-Earth environment. Instances of extreme space weather are rare and are categorized with other natural hazards that have a low frequency but high consequences.

"Obviously, the sun is Earth's life blood," said Richard Fisher, director of the Heliophysics division at NASA Headquarters in Washington.

"To mitigate possible public safety issues, it is vital that we better understand extreme space weather events caused by the sun's activity."

Besides emitting a continuous stream of plasma called the solar wind, the sun periodically releases billions of tons of matter called coronal mass ejections.

These immense clouds of material, when directed toward Earth, can cause large magnetic storms in the magnetosphere and upper atmosphere. Such space weather can affect the performance and reliability of space-borne and ground-based technological systems.

Space weather can produce solar storm electromagnetic fields that induce extreme currents in wires, disrupting power lines, causing wide-spread blackouts and affecting communication cables that support the Internet. Severe space weather also produces solar energetic particles and the dislocation of the Earth's radiation belts, which can damage satellites used for commercial communications, global positioning and weather forecasting. Space weather has been recognized as causing problems with new technology since the invention of the telegraph in the 19th century.

A catastrophic failure of commercial and government infrastructure in space and on the ground can be mitigated through raising public awareness, improving vulnerable infrastructure and developing advanced forecasting capabilities. Without preventive actions or plans, the trend of increased dependency on modern space-weather sensitive assets could make society more vulnerable in the future.

NASA requested the study to assess the potential damage from significant space weather during the next 20 years. National and international experts from industry, government and academia participated in the study. The report documents the possibility of a space weather event that has societal effects and causes damage similar to natural disasters on Earth.

"From a public policy perspective, it is quite significant that we have begun the extremely challenging task of assessing space weather impacts in a quantitative way," said Daniel Baker, professor and director of the Laboratory for Atmospheric and Space Physics at the University of Colorado in Boulder. Baker chaired the panel that prepared the report.

"Whether it is terrestrial catastrophes or extreme space weather incidents, the results can be devastating to modern societies that depend in a myriad of ways on advanced technological systems," said Baker. "We were delighted that NASA helped support bringing together dozens of world experts from industry and government to share their experiences and begin planning of improved public policy strategies."

The sun is currently near the minimum of its 11-year activity cycle. It is expected that solar storms will increase in frequency and intensity toward the next solar maximum, expected to occur around 2012.

The Heliophysics Division of NASA's Science Mission Directorate in Washington provided funding for the study. The division seeks to understand the sun, its solar processes and the interaction of solar plasma and radiation with Earth, other planets and the universe.

Understanding the connections between the sun and its planets will allow better prediction on the impacts of solar activity on humans, technological systems and even the presence of life itself in the universe.

The National Academies are chartered by Congress to provide independent technical and scientific advice to the federal government.

For images related to the study and more information about the Heliophysics Division, visit: http://nasascience.nasa.gov/heliophysics

To view the National Academy of Sciences' complete report, visit: http://www.nap.edu/catalog/12507.html

WEATHER NOTE

Satellites Used To Measure Inland Floods

ScienceDaily (Dec. 23, 2008) — Satellites that were designed to measure sea level over the world's oceans can serve a valuable purpose over land, a new study has found. Researchers used NASA's TOPEX/Poseidon satellite and the European Space Agency's ENVISAT satellite to measure the height and extent of flooding in North America, South America, and Asia.

The study shows that satellites can supplement the measurements that the United States Geological Survey (USGS) gathers from flood gauges on the ground -- at little or no cost, said C.K. Shum, professor of earth sciences at Ohio State University.

"After a flood, we can look back at the satellite data to pinpoint when the flood began, and find out how far the flood waters extended, which is really important for flood modeling," he said.

Satellites such as TOPEX/Poseidon measure the height of land or water by bouncing radio signals off of surfaces and measuring how long the signals take to return.

Rough surfaces scatter some of the signal in other directions, and cause errors in a satellite's on board tracking system. This often happens over land. Scientists use "re-tracking" software to fix the errors, and make the satellite's measurements more precise.

That's what the Ohio State software does -- it re-tracks the satellite data, but in a way that enables detailed measurements of water on land.

The key to the software is an algorithm that can tell the difference between water and snow cover. Ohio State postdoctoral researcher Hyongki Lee developed the algorithm and graduate student Manman Zhang applied the algorithm for her doctoral thesis.

Zhang presented the work in a poster session at the American Geophysical Union meeting in San Francisco.

Shum, Zhang, and their colleagues used the software to process TOPEX/Poseidon data from the 1997 Red River flood in the upper Midwest of the United States, an area with abundant farmland and wetlands. They detected flooded regions within four river basins: the Red River Basin in North Dakota and Minnesota; the Missouri River Basin in North Dakota and South Dakota; and the Minnesota River Basin and the Mississippi River Basin, both in Minnesota and Iowa.

The flood happened in April of that year, as winter snows began to melt. Zhang's algorithm differentiated between the scattered radar signal produced by water and by areas still covered by snow. As the floodwaters began to move down the Red River, the satellite measurements provided estimates of flood levels.

After re-tracking, the satellite data agreed with USGS ground measurements taken at the time. For example, the software determined that flood waters in Grand Forks, North Dakota, rose 20 feet (6 meters), which matched data recorded from flood gauges there.

The researchers did the same for the June 2008 Iowa City flood that killed three people and damaged 2 million acres of farmland. They found that they could track the ebb and flow of that flood over a scale of several hours. For that part of the study, they worked with Carrie Huitger, a USGS hydrologist who supplied the flood gauge data. They performed similar studies with TOPEX/Poseidon data for a flood in the Amazon River Basin, and with ENVISAT data for a flood in southwestern Taiwan -- both with similar results.

The satellites can't be used to forecast a flood because the data isn't processed very quickly and the spatial coverage of the satellite measurements is limited, Shum explained. Even preliminary processing takes hours. But after a flood, such data can add to data collected on the ground, to help scientists better understand how floods happen.

Next, the researchers want to automate the software so that it can build an archive of flood data. Since the satellites are already in orbit collecting the data, there would be little cost beyond building the database and enabling scientists to access it.

In the future, a new satellite may enable more extensive and detailed measurements. Ohio State scientists lead an international team that has proposed the Surface Water Ocean Topography (SWOT) mission. The SWOT satellite will feature dual antennas that will gather high-resolution data over a much wider surface of the earth than is possible with today's satellites.

Collaborators on this project include Doug Alsdorf, associate professor of earth sciences, and Frank Schwartz, professor and Ohio Eminent Scholar in Hydrogeology.

This work was funded by the National Science Foundation and NASA.

Hail tornado severe storms lightning video Australia


MARITIME NOTE

Thousands urge rescue boat return

The crew of a Devon rescue boat is sending out its own SOS to get its vessel reinstated. A petition of 5,000 signatures is being handed in to parliament on Wednesday, saying lives are being put at risk.

The story made headlines last summer when the crew used the boat to rescue a teenage girl at Hope Cove.

The Maritime and Coastguard Agency (MCA), which had warned the crew that the boat was unsafe, impounded it. The MCA is due to hold talks on the issue.

The MCA later brought the boat back, with a restriction that it could be used within a certain distance from the beach in the South Hams area of Devon.

But two months ago the boat was locked away again, this time until a consultation was carried out.

The crew has said the boat is safe and fears lives are being put at risk.
MP Anthony Steen said: "The rescue boat had been successfully operated by four men who were able to launch the boat at a moment's notice in the event of an emergency since they worked locally.

"Now a large stretch of the south Devon coastline is suddenly without adequate sea rescue coverage."

The MCA said Hope Cove was covered by the nearby Salcombe lifeboat.
It said in a statement: "We will be consulting with stakeholders soon to discuss beach safety provision in the South Hams."

FROM HOLLAND AND KNIGHT

Singapore – comments sought re draft amendments to MARPOL Annex I The Singapore Maritime and Port Authority (MPA) issued a circular stating that it is seeking comments from owners, operators, masters, and others regarding draft interim guidelines and draft amendments to MARPOL Annex I adopted by the recent session of the IMO Marine Environment Protection Committee (MEPC). The draft documents relate to: (1) the method of calculation of the energy efficiency design index for new ships; (2) the Supplement to the IOPP Certificate; (3) prevention of pollution during transfer of oil cargo between oil tankers at sea; (4) amendments to Regulations 1, 12, 13, 17, and 38; (5) the IOPP Certificate; and (6) the Oil Record Book. The draft amendments are expected to be adopted at the next session of the MEPC, scheduled for July 2009. Shipping Circular No. 5 of 2009 (1/6/09).

UK – report on container ship-fishing vessel collision The UK Marine Accident Investigation Branch (MAIB) issued the summary of its preliminary examination of a collision between a container ship and a fishing vessel that occurred in good weather off Lizard Point on 18 September 2008. Visibility from the bridge of the container ship was impaired. Neither vessel was maintaining a good lookout or making proper use of their radar. (1/6/09).

UK – contract awarded for MSC NAPOLI wreck removal The UK Maritime and Coastguard Agency (MCA) issued a press notice stating that a contract has been awarded for removal of the stern section of the wreck of the MSC NAPOLI. The scrap is to be delivered to a recovery facility in the Netherlands. (1/6/09).

RS

Monday, January 19, 2009

New Power Line De-icing System Developed

New Power Line De-icing System Developed

(From Storm Reports. Org )

ScienceDaily (Jan. 13, 2009) — Dartmouth engineering professor and entrepreneur Victor Petrenko—along with his colleagues at Dartmouth and at Ice Engineering LLC in Lebanon, N.H.—have invented a way to cheaply and effectively keep ice off power lines.

The new proprietary technology is called a variable resistance cable (VRC) de-icing system. With only minor cable modifications plus some off-the-shelf electronics, the system switches the electrical resistance of a standard power line from low to high. The high resistance automatically creates heat to melt ice build-up or keep it from forming in the first place.

"The beauty of the VRC system is that it's fully customizable and is an affordable addition to the current manufacturing and installation process," said Gabriel Martinez, Ice Engineering's Vice President who studied under Professor Petrenko while earning his M.S. in engineering sciences from Dartmouth. "And it works without causing any service interruption whatsoever," he added.

"The technology builds on many years of research in materials science, power electronics, and ice physics with my colleagues at Dartmouth such as Professor Charles Sullivan, an expert in power electronics and a co-inventor of the VRC de-icer," said Petrenko who is founder, Chief Technology Officer and Chairman of the Board of Ice Engineering.

Ice Engineering plans to install and test a full-scale VRC system prototype on a section of power line in Orenburg, Russia, in late January 2009. The company is also currently negotiating full-scale installations of VRC in other regions of Russia and in China.

Martinez says the changes in manufacturing and installation required to implement the VRC system would result in a less than 10 percent increase in overall cost. Since utility companies normally replace 3 percent of their cables every year, the system could be installed as part of the regularly scheduled maintenance process and still achieve a significant portion of the installation by the time the next major storm hits.

Furthermore, the life span of the de-icing system would match or exceed the life-span of the utility cable, approximately 30–50 years. The system would pay for itself during the next storm by practically eliminating the cost of fixing downed cables and power outages due to ice and snow, according to Martinez.

Another benefit to the VRC system is that utility companies using the system would have full control over its functionality, says Martinez. Time, temperature, and location can all be adjusted manually or set and controlled automatically with electronic sensors.

Ice Engineering in Lebanon, N.H. develops and licenses technology and applications that enable products that interact with ice and snow to perform significantly better than ever before. Dartmouth engineering professor Victor Petrenko is the primary inventor of the technology. Ice Engineering was founded by Petrenko as a Delaware LLC in April of 2001 to commercialize the technology in specific industries.

Weather Note

NOAA Twin Otter Aircraft to Support West Coast Ocean Research, Management

Highly capable plane will be based in Monterey, Calif.
January 12, 2009


Senior federal officials today dedicated a specially equipped twin-engine NOAA aircraft that will support ocean research and management along the West Coast. The NOAA Office of Marine and Aviation Operations is basing the plane and flight crew in Monterey, Calif., to meet the needs of NOAA programs and national marine sanctuaries.

NOAA will use the DHC-6 Twin Otter aircraft to observe marine mammals and other living ocean resources, conduct offshore and coastal surveys, and support emergency response and enforcement missions.

“The highly modified aircraft is well-suited for offshore and coastal surveys and marine resource management,” said John H. Dunnigan, NOAA assistant administrator for the National Ocean Service. “We are pleased that this valuable asset will serve the West Coast.”

Built by de Havilland Canada, the Twin Otter is a maneuverable, versatile aircraft that can be flown at slow speeds and in tight circles. The NOAA version of this high-winged turboprop plane is equipped with color weather radar, dual GPS/Loran-C navigation systems, radar altimeter, and camera ports in the nose and belly areas. A standard flight crew consists of two pilots and up to six scientists.

By basing the aircraft in Monterey, NOAA will have the ability to quickly monitor and protect the waters off the West Coast and Alaska, including five national marine sanctuaries that encompass more than 9,000 square nautical miles of open ocean and remote, rugged coastlines from Washington to the Mexico border. They include Olympic Coast National Marine Sanctuary in Washington, Cordell Bank and Gulf of the Farallones national marine sanctuaries off San Francisco, Monterey Bay National Marine Sanctuary, and Channel Islands National Marine Sanctuary off Santa Barbara.

As part of the NOAA fleet of research and survey ships and aircraft, the NOAA Twin Otter will be operated, managed and maintained by NOAA Corps officers and civilians with the NOAA Aircraft Operations Center. Specific research instrumentation or remote sensing technologies will be supplied by program scientists.NOAA understands and predicts changes in the Earth's environment, from the depths of the ocean to the surface of the sun, and conserves and manages our coastal and marine resources.

Top International Weather Events: 2008

Guest contributor Robert Henson recently ran down his selection of highest impact U.S. weather events of 2008 (1-5, 6-10), while CWG's Ann Posegate reviewed her choice of last year's top D.C. area weather stories.

Weather, of course, knows no boundaries. Year in and year out, extreme weather from around the world offers a treasure trove of fascinating phenomena, many of which have sobering consequences for those in harm's way. International weather can also have significant impacts in the U.S.

Keep reading for my selection of the top 2008 international weather events...

For example, floods and droughts in agricultural centers around the globe can lead to food shortages and price increases in supermarkets here; tropical storms that devastate foreign lands can mean massive U.S. financial aid, ultimately affecting your taxes; and ocean storms can disrupt shipping of imports and exports (and provide great waves for surfing in California and Hawaii!).

I don't ascribe significance to the ordering, since generally I find it too difficult to judge the importance of any single event -- both weather conditions and impacts on human activities, life and property must go into such judgements. Note, too, that I'm avoiding (for now) the question that some might ask about possible links between extreme weather events and climate change.
Cyclone Nargis, a monstrous Category 4 hurricane that developed over the North Indian Ocean, struck Burma (also known as Myanmar) on May 2.

It was not only 2008's most deadly tropical cyclone (estimated 150,000 people killed), but also believed to be second only to Typhoon Nina (1975) as the deadliest named storm on record. See these posts on Nargis from the Capital Weather Gang: Inside the Burma Cyclone and Bangladesh's Example for a Post-Nargis World.

On March 1-2 heavy rains accompanied by hurricane force winds (up to an estimated 125 mph) ripped across central Europe. Thirteen people were killed along the storm's trail of destruction (tens of millions of dollars), which included cars blown off roads, roofs ripped off houses, thousands of felled trees, and bridges collapsed into flooded rivers. It was this storm that led to the near crash (and remarkable, must-see video) of a Lufthansa Airbus A320 as it attempted to land at Hamburg International Airport during high winds.

Flooding of the Kosi River, between Nepal and India, on Sept. 2, 2008 (top), and pre-flood conditions in June (bottom). Courtesy NOAA. Click here to enlarge image.

The 2008 Southeast Asian Monsoon season started earlier than it has in more than a century, and was among the deadliest and most destructive seasons on record. Massive flooding from torrential monsoon rains between June and September resulted in 2,600 deaths and displaced millions of people from inundated villages throughout southern Asia, including India, Bangladesh, Pakistan, Nepal and Vietnam.

Tropical Cyclone Ivan, a borderline Category 4 hurricane, slammed into Madagascar on Feb. 17. Ivan has been described as one of the strongest ever to hit the island nation off the southeastern coast of Africa. It was blamed for at least 22 deaths.

Between Jan. 25 and Feb. 26, a series of winter storms walloped large portions of southern and central China with heavy snow, icing and extreme cold. The winter weather -- China's worst in half a century -- is blamed for 129 deaths and caused massive disruptions in power and transportation, just as millions of Chinese were traveling through the country in celebration of the Chinese New Year.

In South America, a large part of Argentina, Uruguay and Paraguay experienced a prolonged and intense drought during most of 2008, which caused severe damage to agriculture. Heavy rainfall in November caused severe flooding and deadly mudslides in southern Brazil. In what is considered the country's worst weather disaster ever, dozens were left dead and millions isolated in cities behind overflowing rivers.

Widespread heavy rains with severe thunderstorms, damaging winds, hail, and flash floods occurred across much of Australia in November. These events largely ended a long-term drought characterized by severe water shortages and extensive crop failures.Though I've not found it on any list of top weather events of 2008, my sentimental favorite goes to the remarkable and unusual hail (or was it snow?) storm in the vicinity of Exeter in southwest England.

MARITIME NOTE

Scientists Launch First-Ever Exploration of Antarctica's Deep-Sea Vents

Also see Stunning Photos of Antarctica

COMMUNITY NEWS British Antarctic Survey scientists and colleagues from the National Oceanography Centre, Southampton, the Zoological Society of London and Woods Hole Oceanographic Institution in the USA are set to be the first to investigate in detail the creatures living around hot water vents surrounding the coldest continent, Antarctica.

The team is onboard the BAS research ship the RRS James Clark Ross on a voyage to locate and explore life around two poorly understood deep-sea habitats — hydrothermal vents and cold seeps. The five-week NERC-funded project called ChESSO, or Chemosynthetic EcoSystems in the Southern Ocean, is part of a ten-year scientific initiative known as the Census of Marine Life.
The research cruise begins on 14 January and finishes on 18 February.
They will be reporting regularly on classroomatsea.net

American Meteorological Society Recognizes Navy ContributionStory

PHOENIX, Ariz. (NNS) -- The commander of the Naval Meteorology and Oceanography Command (NMOC), was named one of 28 new Fellows of the American Meteorological Society (AMS), the nation's leading professional society for scientists in the atmospheric and related sciences, at the AMS Annual meeting in Phoenix Jan. 12.Rear Adm. David W. Titley, along with other awardees, will be recognized at a banquet Jan. 14. The Fellow is given to an individual for recognition of outstanding contributions to the atmospheric or related oceanic or hydrologic sciences, or their applications, during a substantial period of years.

Only two-tenths of one percent of AMS membership is approved as Fellow each year. "I am humbled to be named an AMS Fellow. As a professional meteorologist, this is a significant honor for me," Titley said. Titley earned a doctorate in meteorology at the Naval Postgraduate School in Monterey, Calif., on tropical cyclone intensification.A native of Schenectady, N.Y., Titley was commissioned through the Naval Reserve Officers Training Commissioning program, after graduating from Pennsylvania State University. He earned a master's in meteorology and oceanography at the Naval Postgraduate School.

He attended the Massachusetts Institute of Technology Seminar XXI on Foreign Politics, International Relations and National Interest from September 2003 to June 2004.Titley's awards include the Legion of Merit, Meritorious Service Medal, Navy Commendation Medal, Navy Achievement Medal, and various unit and service awards. All awards were presented by the U.S. Navy and awarded throughout his 28-year career.NMOC, based at Stennis Space Center, Miss., is a Navy operational command with about 3,500 military and civilian personnel worldwide. The command provides weather and ocean forecasts and geospatial information and services for Navy operations.

Founded in 1919, the AMS has a membership of more than 12,000 professionals, professors, students, and weather enthusiasts. AMS publishes nine atmospheric and related oceanic and hydrologic journals, sponsors multiple conferences annually, and directs numerous education and outreach programs and services. For more news from Naval Meteorology and Oceanography Command, visit www.navy.mil/local/cnmoc/.


Container Vessel Crashes Into Barrier Reef

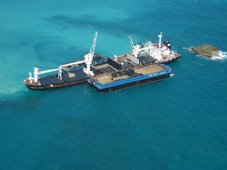
A cargo ship is tonight lodged on Belize’s barrier reef system. It is the Westerhaven – a Netherlands registered vessel that left Belize last night enroute to Santo Tomas in Guatemala. It should have been there by now but while leaving Belize it ran into bad weather and ran aground. 7NEWS travelled 32 miles from the city to the accident site and tonight we’ll show you the ship and underwater footage of the damage it did as it tore through Belize’s reef.

Keith Swift Reporting, We found the Westerhaven cargo ship where it has been since last night – stuck on the reef 32 miles from Belize City in an area near Caye Glory. It ran aground on the reef while sailing out of Belize enroute to Guatemala. This afternoon we met the coast guard on site with an assessment team.

Direl Garrido, Coast Guard“We were called out to assist the DOE and an assessment team to come and check the vessel that grounded here.”

Keith Swift,Have you been on the boat?

Direl Garrido,“No, no.”

Keith Swift,Have you spoken to anyone who has been on the boat?

Direl Garrido,“No sir, nothing. All the information we get from our headquarters.”

Keith Swift,So it is lodged on the reef?

Direl Garrido,“It is aground on the reef, yes.”

Keith Swift,Do you know what efforts are being made to move it?

Direl Garrido,“Right now the assessment team is just conducting an assessment and then based on the result then they will make a decision.”

As the footage shows- it is a large vessel – estimated to be about 100 meters long. A massive ship and it did extensive damage. Marine scientist Melanie McField accompanied us on the boat to the accident site and she says a large area of pristine reef has been destroyed. This is underwater footage she shot with her camera. She says it is the worst reef accident she has ever seen.

Melanie McField, Marine Scientist“This is by far the worst I have ever seen. I’ve never seen anything like this. It is unbelievable. I even saw blast fishing in Indonesia and this looks much worse because it is the whole area.

The reef has been completely levelled, basically from the stern to after the boat. It seems as if the boat just came in on top of, you know the reef has these spurs, it is like hills of corals, valleys of sand, and all the hills of corals have just been scraped clean, levelled. I have never seen anything like it; usually damage is a little bit spotty. And down there near the front of the boat there are areas where big coral heads are knocked over but here in the middle, the whole think is flattened, actually levelled like a parking lot.”

Keith Swift,And what is the size of the area we’re talking about?

Melanie McField,“Well it is basically it is the length of the boat, maybe a little bit less. The two ends aren’t quite as bad. The length of the boat and then out to at least this point where we are here so that’s bigger than a football field.”And as bad as it is – McField the damage has been done and it should be easily moved.

Melanie McField,“There are a few places where it actually pushed into the reef, the spurs as you get towards the reef crest there are a little bit lower but the boat is just pushed on to about two of them so I don’t think they are going to have a lot of trouble getting it off because as you pull it out there is nothing to block the path, all the coral is gone so it should be fairly easy to take it off. It is in a weird position because it is sideways to the current but I don’t think it will be too bad. All of this is levelled so they are not going to hurt much if they pull it off this way.”

Keith Swift,How far is this from the channel?

Melanie McField,“Well they came out the English Caye channel. I don’t know what the legal distance is offshore that they are supposed to travel but they shouldn’t have been travelling anywhere close to the reef crest, especially at night and they should have known where that was with their GPS equipment.”

The ship’s owner – who we are told is on his way to Belize – will be more than likely be fined but McField says no dollar amount can measure the damage.

Melanie McField,“Each square meter of reef is worth something like US$2,000. I haven’t calculated yet but we’ll get out the numbers and it is a lot of square meters that is damaged here and so there should be a considerable fine.”

Keith Swift,What will be the effect on the wider reef system?

Melanie McField,“Well the rest of the reef system, there is some sedimentation coming off of the pulverized reef but that’s pretty negligible. The main thing is that we’ve lost some important habitat. This is really healthy reef. We don’t have a lot of healthy reef, the eco-system report card that we came out with earlier this year was pretty bleak; most of our reef is in poor condition. But this particular chunk of reef is pretty healthy.

This is not the first time it has happened. There was the grounding of a cargo ship back in late November and I think we really need to be tough on our regulations and with Coast Guard, Port Authority, Fisheries, and DOE and get everyone to really come down on these ships. I don’t understand why this is happening.”

The assessment team was still onboard the ship when we left. The ship’s agent in Belize is Eurocaribe Shipping. As we mentioned it was bound for Guatemala and had stopped in Belize for only 4 hours to drop off a few containers. It is registered in the Netherlands and the captain was Fritz Schroeder. It is of note that this is only Schroeder’s 3rd trip as the captain of the Westerhaven to Belize. The owner is on his way to Belize. Tomorrow he is expected to hire a salvage company to tow the ship off the reef.

On a final note – if we use Melanie McField’s math – the ship damaged 10,000 meters of reef which would amount to US$20 million. McField is a marine research scientist with 18 years experience.

RS

Friday, January 9, 2009

Major Southern California quake drill reveals significant gaps in preparations

Major Southern California quake drill reveals significant gaps in preparations

The Nov. 13 'shakeout' showed officials that in the event of a 7.8-magnitude temblor they will need more emergency workers, better sources of water and come up with new ways of restoring electricity.

By Jia-Rui Chong December 27, 2008

The largest earthquake drill in U.S. history, held last month in Southern California, found some serious gaps in local earthquake planning, prompting utility companies, emergency managers and others to rethink their planning for a major temblor.The Great Southern California Shakeout was the first time so many agencies and earthquake officials teamed up to examine what would happen if a huge quake struck the region, in this case a 7.8 magnitude temblor. Many Shakeout participants said they have gone through earthquake drills before, but never with a scenario so detailed.

Based on the results of the Nov. 13 experiment, in which each agency estimated damage and emergency services requirements based on detailed quake scenarios developed by supercomputers, officials said they will need more emergency workers, better sources of water and come up with new ways of restoring electricity.Fire protectionFor local fire officials, one of the most worrisome estimates from the drill was the 1,600 fires expected to ignite with lamps overturning, electrical wires shorting and natural gas lines bursting open. Many fires would grow out of control as firefighters struggle to get fire engines across damaged roads and water stopped coming out of their hoses, experts found.

An estimated 200 million square feet of property would be damaged in the blazes. The fires would cause more than 900 deaths -- about half of the total for the earthquake."To hear it quantified like that, it more than got my attention," said Los Angeles County Fire Chief Michael Freeman. "This was really the worst-case scenario for us. Today, if this were to happen, we would need outside assistance."Unfortunately, Freeman said, they probably would not get help for quite some time because neighboring fire agencies would be fighting fires in their own districts and departments from Northern California would have to make their way around damaged highways.

Because they can't afford to multiply their staffs, several fire agencies are looking into training more members of the community to be first responders, learning such skills as basic first aid and turning off gas lines.Freeman said the county is also looking into ways to better draw water from other sources during a disaster, such as pools or storm drains that are collecting runoff from broken pipes.Water suppliesBut the drill also raised troubling questions about how much water would be available after a major quake. Of all utilities, water would take the longest time to restore, experts found. Some communities might have to wait six months for taps to flow again.

The Shakeout helped officials at East Valley Water District in San Bernardino County estimate that they would see about 1,000 leaks in their 450 miles of pipe because about 40% of their pipes are made from a material that is particularly brittle in earthquakes, said Gary Sturdivan, the district's safety and regulatory manager. All 78,000 of its customers would lose water for some period because all of the agency's reservoirs are on one side of the fault and all of its wells and distribution systems are on the other.As a result, the district plans to stock more replacement pipe parts in repair sheds near those areas and store more bottled water for their employees, employees' families that might stay at their facilities and their customers who need water, Sturdivan said.

The water agencies are also retooling their mutual-aid agreements so they can figure out how to prioritize different agencies' needs and distribute replacement parts or water from other states fairly, he said."I think our agency, like a lot of water agencies, was pretty prepared, but it was glaring that we have a long way to go," Sturdivan said. "It was a little overwhelming."Electrical suppliesThe 7.8 temblor modeled by the test would leave large swaths of Los Angeles, San Bernardino and Riverside counties without power, according to estimates by a working group that included utility companies representatives. Breaks in natural gas pipelines could add delays because many plants use gas to generate electricity.

It probably would take about 10 days to restore power to 90% of customers, the estimates found.But Jim Kelly, senior vice president of transmission and distribution for Southern California Edison, said even that is an optimistic forecast."The problem is harder than people initially think," he said. Although Edison already uses equipment designed to be safer in earthquakes, such as transformers with low centers of gravity, Kelly worried about other utilities and parts vendors that would probably be having problems at the same time.

"If we lose bridges or roadways, how are we going to get people or materials to the job site," Kelly asked. "We don't know if rail transit will be available if we don't have roadways."

When Kelly added these potential problems together, he estimated it would take two to four weeks to restore power to the vast majority of Edison's 12 million customers."The scenario's value to us was in identifying that we have to look broader than just our stuff," he said.

Lucile Jones, the U.S. Geological Survey seismologist who served as the chief scientist for the Shakeout, said she hopes the drill gave agencies concrete data that will help them better prepare."People don't need to be convinced an earthquake can happen," she said. "They need concrete statements so they know what to do about it."The effort to develop the scenario cost about $500,000, engaged some 300 experts and took two years to complete.

Geophysicists wanted to plot a plausible event, so they started the earthquake at a part of the San Andreas that has not moved for more than 300 years. They decided the energy stored in that part of the fault could cause a 200-mile rupture moving northwest from Bombay Beach, at the Salton Sea. Quakes of this size are possible, Jones explained, because they rocked San Francisco in 1906 and Fort Tejon in 1857.Seismologists used the supercomputers to calculate the shaking, generating data for 25,000 points of a grid laid out over Southern California.Geologists, engineers, utility managers and other experts used the data to estimate the damage, which included more than 10,000 landslides, more than 50 sewage spills and more than 100,000 addresses losing phone and Internet service for two or more days. Motorists would have to wait one to two weeks to use arterial roads in cities such as Los Angeles and seven months to use damaged highways.

Public health experts estimated some 1,800 people would die and 50,000 would be seriously injured. The economic costs of the disaster, including the business interruption, would total about $213 billion.

The scientists purposefully avoided a worst-case scenario but wanted to analyze an earthquake far more damaging than the 1994 Northridge earthquake, which had a magnitude of 6.7. "We wanted people to understand how bad it could be," Jones said. "Some people think, 'I've been through Northridge,' but getting through Northridge is not enough."

WEATHER NOTE

FEMA uses multimedia to document Ike response
By
AMY MOORE
December, 23, 2008


The Federal Emergency Management Agency (FEMA) is allowing access to footage of recovery efforts during Hurricane Ike while staying on the cutting edge of multimedia technology, offering online "webisodes" of the Ike response and recovery missions in Texas.

In step with several other federal agencies, the emergency agency is producing video shorts for its online multimedia site at www.fema.gov/media/multimedia/ to bring the efforts of the agency and recovery information directly to the public.

Using social media tools such as YouTube.com, FEMA is able to capture the various recovery efforts in the areas surrounding the upper Texas Gulf Coast and making it available on some of the most active Internet sites.

The agency has produced 14 videos that highlight urban search and rescue, mitigation efforts, volunteerism, community relations, debris management, private sector outreaching, temporary housing and other human interest stories.

These "webisodes" demonstrate the behind-the-scenes, real-life dramas occurring in the response and recovery efforts after Hurricane Ike.

Other online multimedia resources can be found at:
www.youtube.com/fema - includes vignettes about Hurricane Ike recovery efforts and FEMA programs.

www.twitter.com/femainfocus - lets users get the latest FEMA information and participate in forums addressing issues.

www.fema.gov/radio/index.jsp - features mp3 files of recent radio news and Public Service Announcements.

www.photolibrary.fema.gov/photolibrary/index.jsp - includes FEMA's extensive collection of photos from current and previous disaster operation.

MARTIIME NOTE

Independent investigation into the lifeboat incident on board the
Hong Kong flag bulk carrier Ma Cho at Devonport, Tasmania
9 December 2002
Released


SUMMARY

On 8 December 2002, Ma Cho arrived in Devonport, Tasmania, to discharge a part cargo of fertiliser at number four berth on the western side of the river. On 9 December, the master made the decision to conduct an abandon ship drill before the vessel was due to depart for Geelong. The drill commenced at about 1540 and the starboard lifeboat was prepared for lowering to the water.

At approximately 1548 the mate reported that the crew inside the lifeboat were seated and had fastened their safety belts. Lowering of the boat then commenced with one of the crew operating the davit winch brake from the deck.When the boat had been lowered approximately two metres from the davit head the after on-load release hook suddenly opened, releasing the after fall. The lifeboat’s stern fell to leave the boat suspended vertically by the remaining forward fall with its stern swinging approximately five metres above the water. The boat crew were shaken by the incident but remained secured in their seats inside the now vertical lifeboat. The second mate had sustained a small cut over his left eye.

After the crew had disembarked, the lifeboat was lowered to the water to allow the onload release system to be inspected. It was found that the cable operating the after hook was not properly secured by the saddle clamp under the operating unit. Each time the actuating handle was operated, lost motion was induced by the cable sliding through the clamp and this meant that the after hook was not resetting fully. The cable clamp was temporary repaired and then the lifeboat was housed in its davit. MaCho was subsequently cleared to complete the voyage to Geelong.

The report conclusions include:

• The cable clamp securing the aft hook’s operating cable adjacent to the operating mechanism had been modified which resulted in lost motion within the cable.

• As a result of the lost motion in its operating cable, the after hook had not been fully reset when the previous lifeboat drill was conducted on 2 November 2002.• The design of the on-load release system was flawed with respect to the hook locking mechanism.

• The ship’s safety management system was deficient with respect to both the operating and maintenance instructions and to crew training on the on-load release system.

The report makes a general recommendation to ISM Code accreditation authorities regarding ship safety management systems as they relate to on-load release systems. The report also recommends that the lifeboat manufacturer and classification societies review the design of the on-load release system.

Have a really wonderful weekend!
RS

Monday, January 5, 2009

Greensburg, Kansas Tornado Study Complete

Greensburg, Kansas Tornado Study Complete

In one of the most in-depth studies completed of the Greensburg, Kansas tornado outbreak, researchers from the University of Oklahoma have concluded that the mesocyclone that spawned that tornado may have been much stronger than originally believed.

The study authored by meteorologists Les Lemon and Mike Umscheid reveals the minute-by-minute evolution of the once-in-a-lifetime outbreak. As reported in the Kansas City Star (Greensburg study finds that storm contained 22 tornadoes), the storm may have contained more tornadoes than originally thought:

A large, long-lasting tornado 1.7 miles wide and measuring EF5 on the Enhanced Fujita scale virtually wiped Greensburg from the map shortly before 10 p.m. on May 4, 2007. Eleven people were killed and more than 50 others were injured.

It was one of 22 tornadoes that touched down in southern and central Kansas from the same thunderstorm complex on the night of May 4 and early morning of May 5.

That’s more tornadoes than initially thought, said Mike Umscheid, co-author of the study and the meteorologist who issued the “tornado emergency” warning that night for the Dodge City branch of the National Weather Service. A handful of small satellite tornadoes rotating around larger twisters initially went unnoticed.

In particular, a few of the tornadoes were very large and may have exceeded the previous record set by the Moore, OK tornado of May 3, 1999:

The Greensburg tornado registered at the top of the Fujita scale, with peak winds estimated at more than 200 miles an hour based on damage in downtown Greensburg.

The tornado that struck Moore, Okla., and other suburbs of Oklahoma City on May 3, 1999, was labeled perhaps the strongest tornado ever recorded.

But research shows the Greensburg tornado had EF3 or stronger damage in a track at least a mile wide — at least double the size of the Moore tornado.

As always, the tornado strength was measured by the damage path:

After destroying 95 percent of Greensburg, the tornado continued north, then curled left and looped back around, nearly striking the town a second time before lifting…

The Greensburg and Trousdale tornadoes were so intense the weather service’s radar in Dodge City detected vortex holes in them — something the radar had never done before, Umscheid said.

A vortex hole “is what you would see in the eye of a hurricane,” except it’s in a tornado, he said. They form when winds are rotating so rapidly they pull debris and even large raindrops from the storm’s center.

The Trousdale tornado’s vortex hole was about two miles in diameter — or not much smaller than the eye of Hurricane Charley, a Category 4 hurricane in 2004.

This study has also taught many meteorologists more about mesocyclones - the birthplace of tornadoes:

The outbreak featured something else researchers had never seen before: the mesocyclone — or “mother ship” cloud from which tornadoes develop — was rotating as rapidly as the tornadoes.

Typically, the mesocyclones rotate slowly. The Greensburg outbreak featured mesocyclones rotating so rapidly it was hard to tell them apart from the actual tornadoes on radar, the researchers said.

WEATHER NOTE

Hell trip from east timor

TIN Can Bay fisherman Kevin Lee knew there was a big wave out there somewhere as his fishing boat Faysea G pushed its way through atrocious weather and almost total darkness near East Timor.

Kevin knew he had found that big wave when a huge breaker, riding up on the back of another big swell, smashed in the wheelhouse windows, six or seven metres above the waterline on the boat's third level.

In a second, the vessel's upper deck was flooded, the electrics shorted out, fires started inside one wall and circuit breakers cut out the lights and instruments.

“It took out all the electrics. All we had left was the GPS and auto pilot,” Kevin said this week.

Mysteriously, it had the opposite effect on his mobile phone, which had been malfunctioning but which suddenly started working again in the chaos of the wheelhouse.

“The boys thought it was raining downstairs. Water was just pouring down from the top to the bottom deck.

“We lost the 24v and the 240v circuits but we had to get some things back on just to keep going.

“We had to bolt to the engine room and get the generator out.”

Meanwhile, back in Tin Can Bay, Kevin's brother Peter, who was tracking the vessel via satellite, knew something was wrong.

“He knew we were in trouble by the way we'd turned around to go with the sea while we boarded up the smashed windows,” Kevin said.

“We had to get the broken glass out, sealastic a board across the windows, then bolt those to another board inside and tighten it up. Then more sealastic,” he said.

After a season of prawning in Indonesia and a refit, the return trip had been uneventful, except for Kevin's failed attempts to hold down food after picking up a stomach bug in Djakarta.

“From Djakarta to Bundaberg 25 days later, I couldn't eat. I lost about nine or 10kg and ended up in hospital for a couple of weeks.”

Things turned rough as the vessel motored past Timor.

“The sea was flat all the way to East Timor but right from there to Australia we just got smashed.

“It was a hell trip,” he said.

“Hell” was made even worse for Kevin, who had to spend a lot of his time in the cramped and smelly confines of the engine room.

“I'm the skipper/engineer and I had work to do on the engine, even if I was throwing up,” he explained.

Not to mention getting tossed around by the ocean.

“I don't get seasick, not for years, but it was not pleasant,” he said.

Kevin was taking a break in the wheelhouse, extracting what sustenance he could from a hot cup of tea and enjoying being above decks (bad weather or not), when near-disaster came calling.

“I was thinking, gee that's a big wave. We're riding up it and I'm willing the boat to keep moving up. It's midnight, so we couldn't see much.

“Then I saw this second wave breaking on the back of it. Three seconds later it came through and - boom!

“Don't call it a 'freak wave'. I'm not a believer in freak waves. If you're in a bad sea, there's a bad wave coming, just be ready for it.

“I've been doing it all my life and we've got a good crew. No-one freaked out. I would have hated to be in it with people who didn't know what they were doing.

“Mates of mine who know the boat couldn't believe we were in a sea so big we'd blown the windows in - and they're seamen.

“But it won't happen again. We've got 11mm glass across the front now.

“If we hit something that blows that out, I don't want to be on board!”

Kevin was fueling up the Faysea G at his family's Lee Fishing Company headquarters at Snapper Creek, getting ready for the scallop season, not so far away this time, off Bundaberg.

He's hoping for good weather.

MARITIME NOTE

CG Investigates Ship, Bridge Allision


Coast Guard Sector Field Office Grand Haven, Mich., responded to a bridge allision on the St. Joseph River, which occurred shortly before 8 a.m. Dec. 30.

The ship Manistee, a U.S. flagged freighter 620 ft in length, allided with the CSX Swing Bridge. The Coast Guard immediately contacted the owners of the bridge, who found evidence of damage to the bridge's fendering system. Structural engineers have determined that the bridge can safely carry rail traffic. The ship, which was empty, has sustained only minor damage and is not taking on water. No pollution or injuries were reported.

The cause of the incident is under investigation. The Coast Guard is conducting interviews of the witnesses and the vessel's crew, and has begun the required drug and alcohol testing.

Among the Coast Guard's many missions is the responsibility for licensing mariners, inspecting commercial vessels and investigating maritime casualties. Investigations of casualties involving commercial vessels are conducted to learn why the accident occurred in order to reduce the risk of further incidents.

The US Coast Guard issued a press release reminding the maritime community that, effective February 1, 2009, the COSPAS-SARSAT satellites will no longer monitor the 121.5/243 MHz signal transmitted by older Emergency Position Indicating Radio Beacons (EPIRBs). Mariners are strongly encouraged to replace them with the newer 406 MHz EPIRBs, which offer greatly improved performance. (12/31/08).

The Panama Canal Authority issued an advisory reminding the maritime community of restrictions on access to vessel information maintained in the Enhanced Vessel Traffic Management System (EVTMS). Advisory 34-2008 (12/29/08).


RS

Tuesday, December 30, 2008

Oscillation Rules as the Pacific Cools

Oscillation Rules as the Pacific Cools

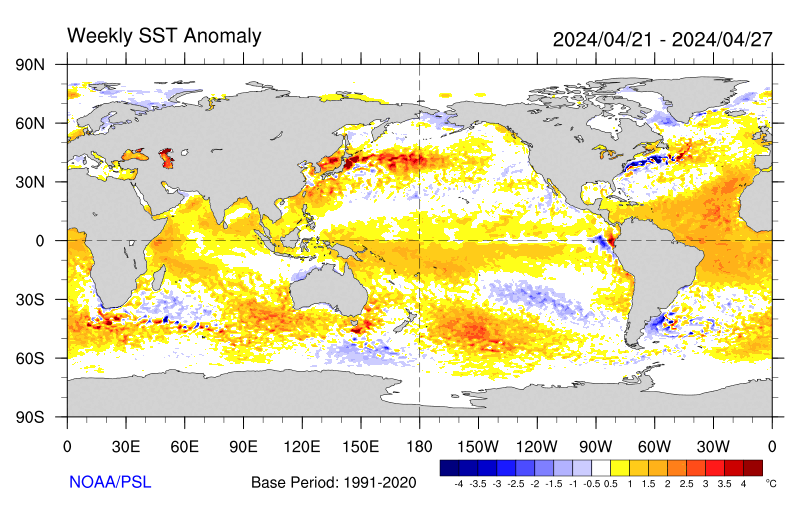
PASADENA, Calif. -- The latest image of sea-surface height measurements from the U.S./French Jason-1 oceanography satellite shows the Pacific Ocean remains locked in a strong, cool phase of the Pacific Decadal Oscillation, a large, long-lived pattern of climate variability in the Pacific associated with a general cooling of Pacific waters. The image also confirms that El Niño and La Niña remain absent from the tropical Pacific.

The new image is available online at: http://www.nasa.gov/topics/earth/features/20081209.html.

The image is based on the average of 10 days of data centered on Nov. 15, 2008, compared to the long-term average of observations from 1993 through 2008. In the image, places where the Pacific sea-surface height is higher (warmer) than normal are yellow and red, and places where the sea surface is lower (cooler) than normal are blue and purple. Green shows where conditions are near normal. Sea-surface height is an indicator of the heat content of the upper ocean.

The Pacific Decadal Oscillation is a long-term fluctuation of the Pacific Ocean that waxes and wanes between cool and warm phases approximately every five to 20 years. In the present cool phase, higher-than-normal sea-surface heights caused by warm water form a horseshoe pattern that connects the north, west and southern Pacific. This is in contrast to a cool wedge of lower-than-normal sea-surface heights spreading from the Americas into the eastern equatorial Pacific. During most of the 1980s and 1990s, the Pacific was locked in the oscillation's warm phase, during which these warm and cool regions are reversed. For an explanation of the Pacific Decadal Oscillation and its present state, see: http://jisao.washington.edu/pdo/ and http://www.esr.org/pdo_index.html .

Sea-surface temperature satellite data from the National Oceanic and Atmospheric Administration mirror Jason sea-surface height measurements, clearly showing a cool Pacific Decadal Oscillation pattern, as seen at: http://www.cdc.noaa.gov/map/images/sst/sst.anom.gif.

"This multi-year Pacific Decadal Oscillation 'cool' trend can cause La Niña-like impacts around the Pacific basin," said Bill Patzert, an oceanographer and climatologist at NASA's Jet Propulsion Laboratory, Pasadena, Calif. “The present cool phase of the Pacific Decadal Oscillation will have significant implications for shifts in marine ecosystems, and for land temperature and rainfall patterns around the Pacific basin.”

According to Nathan Mantua of the Climate Impacts Group at the University of Washington, Seattle, whose research contributed to the early understanding of the Pacific Decadal Oscillation, "Even with the strong La Niña event fading in the tropics last spring, the North Pacific's sea surface temperature anomaly pattern has remained strongly negative since last fall. This cool phase will likely persist this winter and, perhaps, beyond. Historically, this situation has been associated with favorable ocean conditions for the return of U.S. west coast Coho and Chinook salmon, but it translates to low odds for abundant winter/spring precipitation in the southwest (including Southern California)."

Jason's follow-on mission, the Ocean Surface Topography Mission/Jason-2, was successfully launched this past June and will extend to two decades the continuous data record of sea surface heights begun by Topex/Poseidon in 1992. The new mission has produced excellent data, which have recently been certified for operational use. Fully calibrated and validated data for science use will be released next spring.

JPL manages the U.S. portion of the Jason-1 mission for NASA's Science Mission Directorate, Washington. JPL is managed for NASA by the California Institute of Technology in Pasadena.

For more information on NASA's ocean surface topography missions, visit http://sealevel.jpl.nasa.gov/ . To view the latest Jason-1 data, visit http://sealevel.jpl.nasa.gov/science/jason1-quick-look/ .

WEATHER NOTE

Wave surge hits PNG


A huge wave has hit a Papua New Guinea island, submerging buildings and causing widespread damage but no casualties.

The giant wave hit Kavieng, on the New Ireland province, late on Tuesday and there were reports of a similar surge hitting PNG’s north-eastern coast province of East Sepik.

Details remain sketchy but one witness told AAP the water surge hit late this afternoon and disaster teams are now working through the damage.

“The wave took out the hospital and the east coast road of New Island,” local resident Nessie Amos said.

“The hospital’s equipment was washed out but patients were saved and taken to another hospital,” she said.

“There were no casualties but major damage was caused to the hospital and everything was washed out.”

Amos said one small island off Kavieng, Tents, is mostly under water and villagers have been moved to the neighbouring island of Emirau.

Government officials held a press conference in Wewak earlier this evening.

MARITIME NOTE

Report on Collision Death off Pt. Reyes

On Dec. 10, the U.S. Coast Guard released the results of two investigations. One report outlines the causes of the July 13, 2007 fatal collision between a cargo ship and a small fishing boat which occurred in heavy fog off Pt. Reyes, and the other is an internal review of the service's handling of the incident.

The incident involved the 291 ft motor vessel Eva Danielsen, a Bahamian-flagged cargo ship, and a 28 ft wooden fishing vessel, the Buona Madre, home ported in Santa Cruz, California. A collision between the two vessels resulted in the destruction of the fishing boat and the death of Mr. Paul Wade.

A Coast Guard Marine Casualty Investigation, which was conducted by San Francisco-based investigators and reviewed and released from Coast Guard headquarters in Washington D.C., found numerous factors contributing to the cause of the collision including: failure to ensure proper manning of the respective vessels in light of the prevailing weather conditions (heavy fog); and the freighter proceeding at an unsafe speed based upon the weather conditions, failing to follow applicable Navigational Rules of the Road (i.e., fog signals), and negligence with respect to the operation of the vessel.

An internal administrative investigation was also conducted by the 11th Coast Guard District to evaluate how Coast Guard policies and procedures were followed. The internal investigation found that some internal briefing requirements and communications processes were not followed. Several recommendations of the report have been adopted to improve management of communications among Coast Guard units including: Revision of Command Center Standard Operating Procedures to include recent CG policy changes; review and revision of all Quick Response Sheets (QRS) to ensure proper notifications are made in a timely fashion; Introduction of Search and Rescue fundamentals in the Coast Guard Vessel Traffic Service (VTS) training program; and cross training among various watch positions in the Coast Guard Sector Command Center and VTS.


RS

Tuesday, December 2, 2008

How Global Warming May Affect U.S. Beaches, Coastline

How Global Warming May Affect U.S. Beaches, Coastline

ScienceDaily (Nov. 24, 2008) In “Dover Beach,” the 19th Century poet Matthew Arnold describes waves that “begin, and cease, and then again begin…and bring
the eternal note of sadness in.”

But in the warming world of the 21st Century, waves could be riding oceans that will rise anywhere from 0.5 meters (19 inches) to 1.4 meters (55 inches), and researchers believe there’s a good chance they will stir stronger feelings than melancholia.

Several scientists from Scripps Institution of Oceanography at UC San Diego are finding that sea level rise will have different consequences in different places but that they will be profound on virtually all coastlines. Land in some areas of the Atlantic and Gulf coasts of the United States will simply be underwater.

On the West Coast, with its different topography and different climate regimes, problems will likely play out differently. The scientists’ most recent conclusions, even when conservative scenarios are involved, suggest that coastal development, popular beaches, vital estuaries, and even California’s supply of fresh water could be severely impacted by a combination of natural and human-made forces.

Scripps climate scientists often consider changes in average conditions over many years but, in this case, it’s the extremes that have them worried. A global sea level rise that makes gentle summer surf lap at a beachgoer’s knees rather than his or her ankles is one thing. But when coupled with energetic winter El Niño-fueled storms and high tides, elevated water levels would have dramatic consequences.

The result could transform the appearance of the beaches at the heart of California’s allure.

“As sea level goes up, some beaches are going to shrink,” said Scripps oceanographer Peter Bromirski. “Some will probably disappear.”

Sea level has been trending upward for millennia. For the last 6,000 years, it is estimated that global sea levels have rising an average of five centimeters (2 inches) per century. Before that, between 18,000 and 6,000 years ago, the seas rose a full 120 meters (400 feet). Step by step, they bit into rocky coastlines like California’s by smashing cliffs, creating beaches with the debris, rising a bit more, and repeating the process over and over again.

Humans are speeding up the pace of that assault. The United Nations-sponsored Intergovernmental Panel on Climate Change (IPCC) reported that sea level rose, on average, 1.7 millimeters (0.07 inches) per year over the entire 20th Century. But recent estimates from satellite observations find a marked increase, at 3.1 millimeters (0.12 inches) per year since 1993.

The oceans are rising because the warming ocean water increases in volume and because water is being added from melting glaciers and land-based ice sheets. The complex difficult-to-predict contribution of the latter is such a matter of controversy that the recent IPCC Fourth Assessment report didn’t factor glacial melt into its sea level rise estimates. Today there is quite broad-based opinion that the IPCC estimates are considerably lower than the higher range of possible sea level rise. Some individuals, pointing to the quantity of water frozen in Greenland and Antarctica and to ancient sea level evidence, have suggested that sea level rise could reach several meters by the end of the 21st Century. However, an August paper in the journal Science co-authored by former Scripps postdoctoral researcher Shad O’Neel suggests that some of the more exaggerated claims that water could rise upwards of 10 meters (33 feet) by century’s end are not in the realm of possibility. O’Neel and co-authors indicate that the realities of physics impose a cap of 2 meters (6.6 feet) for possible sea level rise by 2100.

“That’s fine,” said Scripps climate researcher Dan Cayan, who is leading an analysis of climate change scenarios for the state of California, “but two meters is still enough to do a lot of damage.”

Recent news footage of overtopped levees makes it easy to envision what two meters’ difference means to low-lying cities like New Orleans, especially when extreme events like hurricanes are factored in. Any flooding would be proportionately higher than it is now. Additionally Bromirski recently showed that sea level rise will amplify the power and frequency of hurricane-generated waves that reach shore, even if the storms themselves don’t make landfall.

In contrast to the beaches of the East Coast, many of which are covered with vast expanses of sand, California’s coastline is predominantly bedrock covered by a relatively thin veneer of sand. That sand can shift or disappear during storms. Thus, preserving the precious supply that keeps the tourists coming has for decades been a priority for state officials. Resource management, however, has required them to make trade-offs. They have constructed seawalls to protect houses built on ocean cliffs. They have dammed rivers to create supplies of water for drinking and to prevent floods and debris from damaging downstream developments.

In so doing, nature’s two primary sources of beach replenishment have been muted in a process known as passive erosion. Managers have compensated through artificial beach replenishment projects but at a costs that approach $10 per cubic yard. Since usually millions of cubic yards of sand need to be moved, there are monetary limits to what they can reasonably accomplish.

Reinhard Flick, who received his doctorate in oceanography from Scripps in 1978, needs only to look out his office window to watch the losing battle of beaches unfold. During his student days, he used to play volleyball on stretches of sand that are now underwater except during low tide. Rocks buried under several feet of sand four decades ago are now exposed for large parts of the year.

The staff oceanographer for the California Department of Boating and Waterways, Flick said that seawalls causing passive erosion will likely combine with sea level rise to doom some Southern California beaches. The change will become most apparent during El Niño events, when a pool of warm Pacific Ocean water settles off the coast for a year or two. El Niño has a dual effect on the West Coast. It not only feeds more intense storms but the warm ocean water itself causes a temporary spike in sea level that is above and beyond the rise that climate change is causing. During the 1997-98 El Niño, for instance, tide gauges off San Francisco recorded that sea level was 20 centimeters (8 inches) above normal for more than a year, including the winter storm season. That temporary rise is about equal to the rise observed for the entire 20th Century.

If sea levels rise substantially, when a large storm coincides with a high tide during an El Niño event, there could be widespread inundation along the California coast. Effects could range from a submersion of areas of San Diego’s Mission Beach to an inundation of the Sacramento-San Joaquin Delta. There, an overtopping of the delta’s levees by brackish water could paralyze the main component of the state’s water delivery system. Cayan noted that repairs to the system could take months.

The threat resonates with state officials, who have tasked Scripps and other institutions with creating and updating sea level rise scenarios.

“There’s no clear path forward with sea level rise,” said Tony Brunello, deputy secretary for climate change and energy at the California Resources Agency, a key Scripps partner in developing the state’s response to manifestations of global warming. “You typically want to work with one number (but) what we want people to do is work with the whole range of estimates.”

Cayan and other Scripps researchers who are collaborating to study sea level rise emphasize that there remains a great deal of uncertainty in the creation of estimates for the coming century. The range of rise estimated by Cayan is based on scenarios of global air temperatures over the next 100 years, which range from about 2° C (3.6° F) to about 6° C (10° F). By 2100, global sea level rise reaching a half-meter seems likely, and if the higher rates of potential warming occur it could rise by more than one meter. The potential cost of any government project or policy change puts a high premium on narrowing this range. As O’Neel and his co-authors observed in their paper, the cost of raising Central Valley levees only 15 centimeters (6 inches) to prepare for higher sea levels has been estimated at more than $1 billion.

“These are very broad-brush preliminary kinds of studies right now, but you have to start somewhere,” said Scripps coastal oceanographer Bob Guza.

Flick said it will be essential for scientists to be able to study the effects of the next El Niño so they can begin to understand not just where damage will happen on the California coast but to what extent. He only had surveyor’s equipment and aerial photos available to him to measure beach changes after the 1982-83 El Niño, but Guza and his collaborators now have light detection and ranging (LIDAR) and GPS technologies to make precise surveys of beach and cliff damage. Guza and Flick hope that Scripps can not only enhance its use of such technology but to deploy it within hours of a major storm event.

“We need to be geared up to quantify what beach changes are,” said Flick. “We have to do an even better job of studying wave forces and wave climate.”

If there’s any good news for Southern California, Scripps climate scientist Nick Graham has estimated that ocean warming trends will drive storm tracks farther north, perhaps sparing the state’s lower half from the full brunt of buffeting El Niño waves the 21st Century will generate. Graham compared winds produced in three different simulations of climate change with those generated in the late 20th Century. The models showed that Southern California can expect a moderate decrease in wave size of about 0.25 meters (10 inches). But even there, Graham sees a problem.

“I’m a surfer. I think that’s horrible,” he said.

WEATHER NOTE

New comprehensive report on impact of earthquakes in the Central USA


DOWNLOAD THE REPORT HERE


The Mid-America Earthquake (MAE) Center at the University of Illinois announces the release of its report entitled "Impact of Earthquakes on the Central USA". The report is the outcome of one of the largest and most comprehensive earthquake consequence assessment projects funded by the Federal Emergency Management Agency (FEMA).

The report contains earthquake impact assessments for the 8 central US (CUSEC) states, and lists damage and other consequences to the built environment as well as social and economic impacts. The earthquake scenarios used represent the New Madrid, the Wabash Valley and the East Tennessee seismic zones. The analysis employs new and more reliable hazard and inventory data that has not been used before.

The project is managed by the US Army Corps of Engineers, Construction Engineering Research Laboratory, and the work was undertaken in partnership with the Institute for Crisis, Disaster and Risk Management at the George Washington University, with contributions for the 8 State Geological Surveys, IEM, FEMA, US Geological Survey and CUSEC. The report is available for download at IDEALS .

Bound paper and CD copies are available from Jessica Vlna, Program Coordinator, email: vlna@illinois.edu.

MARITIME NOTE

Ship's accidents of different kind.


Ship's Disasters Gallery 2007 - Click here for more blooper videos


RS

Friday, November 28, 2008

Atlantic Hurricane Season Sets Records

Atlantic Hurricane Season Sets Records

November 26, 2008

The 2008 Atlantic Hurricane Season officially comes to a close on Sunday, marking the end of a season that produced a record number of consecutive storms to strike the United States and ranks as one of the more active seasons in the 64 years since comprehensive records began.

A total of 16 named storms formed this season, based on an operational estimate by NOAA's National Hurricane Center. The storms included eight hurricanes, five of which were major hurricanes at Category 3 strength or higher. These numbers fall within the ranges predicted in NOAA’s pre- and mid-season outlooks issued in May and August. The August outlook called for 14 to 18 named storms, seven to 10 hurricanes and three to six major hurricanes. An average season has 11 named storms, six hurricanes and two major hurricanes.

“This year’s hurricane season continues the current active hurricane era and is the tenth season to produce above-normal activity in the past 14 years,” said Gerry Bell, Ph.D., lead seasonal hurricane forecaster at NOAA's Climate Prediction Center.

Overall, the season is tied as the fourth most active in terms of named storms (16) and major hurricanes (five), and is tied as the fifth most active in terms of hurricanes (eight) since 1944, which was the first year aircraft missions flew into tropical storms and hurricanes.

For the first time on record, six consecutive tropical cyclones (Dolly, Edouard, Fay, Gustav, Hanna and Ike) made landfall on the U.S. mainland and a record three major hurricanes (Gustav, Ike and Paloma) struck Cuba. This is also the first Atlantic season to have a major hurricane (Category 3) form in five consecutive months (July: Bertha, August: Gustav, September: Ike, October: Omar, November: Paloma).

Bell attributes this year’s above-normal season to conditions that include:

  • An ongoing multi-decadal signal. This combination of ocean and atmospheric conditions has spawned increased hurricane activity since 1995.
  • Lingering La Niña effects. Although the La Niña that began in the Fall of 2007 ended in June, its influence of light wind shear lingered.
  • Warmer tropical Atlantic Ocean temperatures. On average, the tropical Atlantic was about 1.0 degree Fahrenheit above normal during the peak of the season.


Download as Quicktime (Credit: NOAA)

NOAA's National Hurricane Center is conducting comprehensive post-event assessments of each named storm of the season. Some of the early noteworthy findings include:

  • Bertha was a tropical cyclone for 17 days (July 3-20), making it the longest-lived July storm on record in the Atlantic Basin.
  • Fay is the only storm on record to make landfall four times in the state of Florida, and to prompt tropical storm and hurricane watches and warnings for the state’s entire coastline (at various times during its August lifespan).
  • Paloma, reaching Category 4 status with top winds of 145 mph, is the second strongest November hurricane on record behind Lenny in 1999 with top winds of 155 mph).

Much of the storm-specific information is based on operational estimates and some changes could be made during the review process that is underway.

“The information we’ll gain by assessing the events from the 2008 hurricane season will help us do an even better job in the future,” said Bill Read, director of NOAA's National Hurricane Center. “With this season behind us, it’s time to prepare for the one that lies ahead.”

NOAA will issue its initial 2009 Atlantic Hurricane Outlook in May, prior to the official start of the season on June 1.

NOAA understands and predicts changes in the Earth's environment, from the depths of the ocean to the surface of the sun, and conserves and manages our coastal and marine resources.

WEATHER NOTE

Mother nature on display


Dalyellup resident Jaco Bosman snapped this image of a water spout forming off the coast of Bunbury on Saturday afternoon.

A DALYELLUP resident in the right place at the right time witnessed a marvel of Mother Nature on the weekend – a waterspout off Bunbury’s coast.

Jaco Bosman was driving past Dalyellup Beach on Saturday evening when the meteorological phenomenon caught his eye.

Mr Bosman pulled over and watched the water spout for about a minute or two before it disappeared out of sight.

“I just caught the last of the show,” he said.

“It is the kind of thing you see on the Discovery Channel.

“I didn’t expect to see it happen in real life.”

A waterspout is an intense columnar vortex usually appearing as a funnel-shaped cloud that occurs over a body of water and is connected to a cumuliform cloud.

Waterspouts have long been recognised as serious marine hazards and history is filled with examples of ships being destroyed or damaged by them.

Meteorologist Joe Courtney said the waterspout formed due to unstable weather conditions on Saturday and rotating columns of air.

MARITIME NOTE

News from Holland and Knight

DOJ – tanker firm pays additional fine

The US Attorney for the Eastern District of Texas issued a news release stating that an oil tanker firm an additional $3 million fine after pleading guilty to additional charges relating to false entries in the oil record book of one of the company’s tankers. Prosecutors previously credited the company’s self-disclosures, cooperation, and compliance measures by proposing fewer charges and reduced criminal fines. (11/24/08).

IMO – SAR agreement between Australia & New Zealand

The IMO issued a circular forwarding an agreement between Australia and New Zealand on search and rescue (SAR) regions and coordination. SAR.6/Circ.31 (10/21/08).

THE REMAINS OF THE KURSK

http://img95.imageshack.us/img95/7521/kurskwz1.jpg

The scrapping of the Kursk.

Special Thanks to Bud Shortridge
U.S. Naval Ship Research Hobbiest

The K-141 Kursk sank on August 12, 2000 in the Barents Sea with all hands. These photo's below are from the salavge of the K-141 (Kursk).

The bow of the Kursk was sawed off with a diamond rope while she sat on the bottom of the Arctic Sea. You can see the antiship missiles still in their launchers all foamed in. And there is a nuclear power plant in in the wreckage.

The K-141 Kursk was a Russian nuclear cruise missile submarine which was lost with all hands when it sank in the Barents Sea on August 12, 2000. It was named after the Russian city Kursk, around which the largest tank battle in military history, the Battle of Kursk, took place in 1943.

The Kursk sailed out to sea to perform an exercise of firing dummy torpedoes at Pyotr Velikiy, a Kirov class battlecruiser. On August 12, 2000 at 11:28 local time , the missiles were fired, but an explosion occurred soon after on Kursk. The only credible report to-date is that this was due to the failure and explosion of one of Kursks new/developmental torpedoes.

The blast from the explosion registered 2.2 on the Richter scale. The submarine sank to a depth of 108 metres (354 feet), approximately 135km (85 miles) off Severomorsk. Severomorsk is a closed town in Murmansk Oblast, Russia and is located about 25 kilometers (16 mi) north of Murmansk along the Kola Bay. This is the main administrative base of the Russian Northern Fleet.Severomorsk has the largest dry dock in the Kola Peninsula.

A second explosion occured on the K-141, 135 seconds after the initial event and measured between 3.5 and 4.4 on the Richter scale, equivalent to 3-7 tons of TNT. Either this explosion or the earlier one propelled large pieces of debris far back through the submarine. The Kursk was eventually raised from her grave by the Dutch team, Smit International. using the barge Giant 4, and 115 of the 118 dead were recovered and laid to rest in Russia .

Russian officials have strenuously denied claims that the sub was carrying nuclear warheads. When the boat was raised by a salvage operation in 2001 there were considerable fears moving the wreck could trigger explosions.

The Salvage of the k-141 Kurst.


http://www.tridentmilitary.com/new-photos10/b184.jpg


May her lost and brave souls rest in peace.

RS