Showing posts with label gulfstream. Show all posts

Friday, February 15, 2008

CODAR And Marine Operations.

CODAR stands for Coastal Ocean Dynamics Applications Radar, or in short, Coastal RADAR.

What is CODAR?

According to the CoolRoom, CODAR is a High Frequency (HF) radar system that remotely measures ocean surface currents. The system allows one to get a complete map of ocean currents (left) without stepping foot aboard a boat or deploying an expensive array of current meters. Each map has a range of about 50 kilometers (about 30 miles) from the coast with a measurement every 1.5 kilometers ( 0.9 miles). The Rutgers University CODAR system, deployed along the New Jersey coast, is the only operational HF-Radar system of its kind in the entire eastern United States. It consists of two remote sites, located in Brant Beach and Brigantine New Jersey, and a central site in Tuckerton, New Jersey.

How does it all work??
Each remote site contains two antennas and a small 6'x 8' shed. One antenna (left) transmits a radio wave out across the ocean surface. The power of this transmitted signal is only 40 watts. Therefore this antenna behaves like a household lamp with a 40 watt light bulb. Unlike radio stations that only transmit a signal, CODAR uses the second antenna (far left) to listen for and measure the transmitted signal. So that the part of the transmitted signal that is reflected back toward the site by the ocean waves can be recorded and processed. It is this returned signal that is used to measure the moving ocean surface.

The shed (right) contains a weatherproof box (lower right) that houses all of the equipment necessary for transmitting, receiving and processing the radio signal. Within this box (from top to bottom) there is a Macintosh computer, responsible for processing the incoming signal, a transmitter and a receiver.

How can we get ocean currents from the beach?
CODAR uses the theories of the Doppler Shift to determine the surface current from the backscattered radio wave. The Doppler shift explains the change in frequency of a signal scattered off a moving object. For example, a train whistle or ambulance siren sounds different depending on the speed and direction of the vehicle. Doppler theory can be used to determine if a scattering object is moving toward or away from an observer as well as the speed at which it is moving. These theories also apply to the ocean surface.

By measuring the return signal, the CODAR system can determine the speed of the ocean waves that scattered the signal. From this wave speed a surface current can be calculated. One limitation to Doppler theory is that it only explains the velocity of the train in the direction of the observer.

Consequently, a remote site can only measure how fast the water is moving toward or away from the antennas (left). The net movement of the water (shown in red) can only be determined using information collected from each of the two sites (shown in green and yellow), as illustrated in the figure to the left.

CODAR Applications

  • Safe and efficient navigation and marine operations
  • Efficient oil and hazardous material spill trajectory prediction and clean up
  • Monitoring, predicting and mitigating coastal hazards
  • Military operations
  • Education
  • Scientific research
  • Search and rescue

The Future of CODAR along the New Jersey Coast
The future of the CODAR system along the New Jersey coast involves plans to increase the present area of coverage. To accomplish this, several adaptations will be made to the present system. The first will add two additional transmit antennas offshore. In addition to extending the coverage in both the along-shore and cross-shore directions, this improved system will be able to measure surface currents right to the beach (left). By measuring these currents, one can begin to examine storm effects on beach erosion as well as complicated inlet dynamics influencing commercial traffic.

The second adaptation changes the frequency of the transmitted radio wave so that the signal will travel further offshore resulting in a much larger coverage area. The figure to the right illustrates the present configuration in yellow. Using three of these new long-range systems, the coverage area will be extended to include those areas shaded in red, blue and green. Also shown in the illustration is the location of three recent ship sinkings off the New Jersey coast. One can easily see that with the larger coverage area perhaps current maps could have been used by the Coast Guard to more efficiently aid those in distress.

CODAR Ocean Systems website.

CODAR surface current maps powered by Google™

Underwater glider studies the sea

A seafaring glider that draws its energy from the ocean has become the first so-called "green" robot to monitor the undersea environment. The glider powers itself by harnessing the temperature difference felt at different depths. It has crisscrossed a deep undersea basin near Puerto Rico more than 20 times for a study on ocean circulation, say researchers at Woods Hole Oceanographic Institution and Webb Research Corp. in Massachusetts. The glider should be able to work around the clock in all weather conditions.

Weather spotter classes offered
Henderson Gleaner - Henderson,KY,USA
The training sessions are offered throughout the region, mostly during January through March to prepare for peak severe weather season.


MARITIME NOTES:

Ocean Dead-Zones May Be Linked To Global Warming (February 15, 2008) -- A review of all available ocean data records concludes that the low-oxygen events which have plagued the Pacific Northwest coast since 2002 are unprecedented in the five decades prior to that, and may well be linked to the stronger, persistent winds that are expected to occur with global warming. In a new study in Science, researchers outline a "potential for rapid reorganization" in basic marine ecosystems and the climatic forces that drive them, and suggest that these low-oxygen, or "hypoxic" events are now more likely to be the rule rather than the exception. ... full story

EMSA – report on pollution preparedness and response

The European Maritime Safety Agency (EMSA) issued its annual report for 2007 on Pollution Preparedness and Response. The report focuses on the network of stand-by oil recovery vessels around Europe and the European satellite oil spill monitoring and detection service – CleanSeaNet. (1/31/08).

SEA EMPRESS casualty

On February 15, 1996, the tanker SEA EMPRESS grounded off the mouth of the Cleddau Estuary as it was making its way to Milford Haven, Wales to offload a cargo of crude oil. The ship eventually spilled an estimated 73,000 tons of crude oil in an event that was widely televised around the UK and the world. The primarily cause of the casualty was found to be an error in judgment by the pilot. A root cause was found to be inadequate training and examination of pilots by the Milford Haven Port Authority. This casualty was a significant factor in the subsequent enactment of legislation in the UK clarifying the authority for overseeing spill response and salvage. Further information may be found in the MAIB Report.

Live NewsCarmeras.com

TV stations are streaming various in-house news feeds live on the 'net, and the network has decided to experiment to let you see them all on a real-time basis. Some of them are just test patterns or dark screens when nothing is going on; others are web feeds of their radar, and some are live video streaming tower cams. Several are from "Tornado Alley", including Denver, CO and Dallas and Austin, TX. All of it is raw, so anything goes; whatever they decide to spit out, you see it. Live NewsCarmeras.com

READERS COMMENTS:

Jim C, asks.

"Robin,

I am baffled by the fact that in tornado alley each house or permanent structure doesn't have a tornado shelter, storm cellar, or basement.

I live in Denver Colorado and cannot imagine not having a basement to go to when the weather turns severe. We are not even as prone to it as some areas of the country.

To me, not having a storm shelter in tornado alley makes about as much sense as not having a snow shovel here in Denver."

Jim, good question. So I posed this to my peers on the WX-Chase listserve. The response was across the board. Most folk do not have basements in tornado alley because of either the geology ( either poor soil or heavy rock) or very high water table, while the cost of putting one in would be excessive. Though one experienced storm spotter/chaser did correct me when I exempted mobile homes, by saying nope, if the ground is doable they can have mobile homes mounted over basements.

FINALLY

Ferry mess mired in myopic decision-making


COUPEVILLE, Washington (STPNS) -- I am a former officer with the National Oceanic and Atmospheric Administration, having sailed the Pacific from Alaska to Midway to Hawaii to Tahiti to Chile. I have sailed in storms with 50-foot swells and 80-mph winds in which all one can do in a 300-foot ship with twin screws and a bow thruster is keep the bow into the swells to prevent being rolled over and pray the engines don't quit.

I am not sure why the US Coast Guard considers the waters of Admiralty Inlet "protected waters" unless it is simply because it is not the open ocean. This is the same Coast Guard that failed to detect, during numerous inspections, the massive pitting in the hulls of the 80-year-old boats from the Keystone-Port Townsend run. (STORY)


HAVE A GREAT A ENJOYABLE WEEKEND!

RS

Thursday, August 2, 2007

Third in a Series; Subsea Atmospheres - Waves

Waves in the environment
By
Dr J Floor Anthoni

Without waves, the world would be a different place. Waves cannot exist by themselves for they are caused by winds. Winds in turn are caused by differences in temperature on the planet, mainly between the hot tropics and the cold poles but also due to temperature fluctuations of continents relative to the sea.
Without waves, the winds would have only a very small grip on the water and would not be able to move it as much. The waves allow the wind to transfer its energy to the water's surface and to make it move. At the surface, waves promote the exchange of gases: carbon dioxide into the oceans and oxygen out. Currents and eddies mix the layers of water which would otherwise become stagnant and less conducive to life. Nutrients are thus circulated and re-used. The large ocean currents transport warm water from the tropics to the poles and cold water the other way. They help to stabilise the planet's temperature and to minimise its extremes. For instance, because of warm ocean currents arriving from the north, the temperature of New Zealand is 3-4 degrees higher than it would be without them.

For the creatures in the sea, ocean currents allow their larvae to be dispersed and to be carried great distances. Many creatures spawn only during storms when large waves can mix their gametes effectively.

Coastal creatures living in shallow water experience the brunt of the waves directly. In order to survive there, they need to be robust and adaptable. Thus waves maintain a gradient of biodiversity all the way from the surface, down to depths of 30m or more. Without waves, there would not be as many species living in the sea.

Waves pound rocks and make them erode faster, but sea organisms covering these rocks, delay this process. Waves make beaches by transporting sand from deeper down towards the shore and by washing the sand and removing fine particles. Waves stir and suspend the sand so that currents or gravity can transport it.

Wave motion
Anyone having watched water waves rippling outward from the point where a stone was thrown in, should have noticed how effortlessly waves can propagate along the water's surface. Wherever we see water, we see its surface stirred by waves. Indeed, witnessing a lake or sea flat like a mirror, is rather unusual. Yet, as familiar we are with waves, we are unfamiliar with how water particles can join forces to make such waves.

Waves are oscillations in the water's surface. For oscillations to exist and to propagate, like the vibrating of a guitar string or the standing waves in a flute, there must be a returning force that brings equilibrium. The tension in a string and the pressure of the air are such forces. Without these, neither the string nor the flute could produce tones. The standing waves in musical instruments bounce their energy back and forth inside the string or the flute's cavity. The oscillations that are passed to the air are different in that they travel in widening spheres outward. These travelling waves have a direction and speed in addition to their tone or timbre. In air their returning force is the compression of the air molecules. In surface waves, the returning force is gravity, the pull of the Earth. Hence the name 'gravity waves' for water waves.

In solids, the molecules are tightly connected together, which prevents them from moving freely, but they can vibrate. Water is a liquid and its molecules are allowed to move freely although they are placed closely together. In gases, the molecules are surrounded by vast expanses of vacuum space, which allows them to move freely and at high speed. In all these media, waves are propagated by compression of the medium. However, the surface waves between two media (water and air), behave very different and solely under the influence of gravity, which is much weaker than that of elastic compression, the method by which sound propagates.

The specific volume of sea water changes by only about 4 thousands of 1 percent (4E-5) under a pressure change of one atmosphere (1 kg/cm2). This may seem insignificant, but the Pacific Ocean would stand about 50m higher, except for compression of the water by virtue of its own weight, or about 22cm higher in the absence of the atmosphere. Since an atmosphere is about equal to a column of water 10m high, the force of gravity is about 43 times weaker than that of elastic compression.
Surface tension (which forms droplets) exerts a stress parallel to the surface, equivalent to only one 74 millionth (1.4E-8) of an atmosphere. Its restoring force depends on the curvature of the surface and is still smaller. Nevertheless it dominates the behaviour of small ripples (capillary waves), whose presence greatly contributes to the roughness (aerodynamic drag) of the sea surface, and hence, to the efficiency with which can generate larger waves and currents. (Van Dorn, 1974)

If each water particle makes small oscillations around its spot, relative to its neighbours, waves can form if all water particles move at the same time and in directions that add up to the wave's shape and direction. Because water has a vast number of molecules, the height of waves is theoretically unlimited. In practice, surface waves can be sustained as high as 70% of the water's depth or some 3000m in a 4000m deep sea (Van Dorn, 1974).
Note that the water particles do not travel but only their collective energy does! Waves that travel far and fast, undulate slowly, requiring the water particles to make slow oscillations, which reduces friction and loss of energy.

Wave motionIn the diagram some familiar terms are shown. A floating object is observed to move in perfect circles when waves oscillate harmoniously sinus-like in deep water. If that object hovered in the water, like a water particle, it would be moving along diminishing circles, when placed deeper in the water. At a certain depth, the object would stand still. This is the wave's base, precisely half the wave's length. Thus long waves (ocean swell) extend much deeper down than short waves (chop). Waves with 100 metres between crests are common and could just stir the bottom down to a depth of 50m. Note that the depth of a wave has little to do with its height! But a wave's height contains the wave's energy, which is unrelated to the wave's length. Long surface waves travel faster and further than short ones. Note also that the forward movement of the water under a crest in shallow water is faster than the backward movement under its trough. By this difference, sand is swept forward towards the beach.

Water waves can store or dissipate much energy. Like other waves (alternating electric currents, e.g.), a wave's energy is proportional to the square of its height (potential). Thus a 3m high wave has 3x3=9 times more energy than a 1m high wave. When fine-weather waves of about 1m height pound on the beach, they dissipate an average of 10kW (ten one-bar heaters) per metre of beach or the power of a small car at full throttle, every five metres. (Ref Douglas L Inman in Oceanography, the last frontier, 1974). Attempts to harness the energy from waves have failed because they require large structures over large areas and these structures should be capable of surviving storm conditions with energies hundreds of times larger than they were designed to capture.

Waves have a direction and speed. Sound waves propagate by compressing the medium. They can travel in water about 4.5 times faster than in air, about 1500m per second (5400km/s, or mach-4.5, depending on temperature and salinity). Such waves can travel in all directions and reach the bottom of the ocean (about 4km) in less than a second. Surface waves, however, are limited by the density of water and the pull of gravity. They can travel only along the surface and their wave lengths can at most be about twice the average depth of the ocean (2 x 4 km). The fastest surface waves observed, are those caused by tsunamis. The 'tidal wave' caused by an under-sea earthquake in Chile in May 1960, covered the 6000 nautical miles (11,000km) to New Zealand in about 12 hours, travelling at a speed of about 900 km/hr! When it arrived, it caused an oscillation in water level of 0.6m at various places along the coast, 1.4m in Tauranga Harbour and 2.4m in Whitianga harbour. Note that tsunamis reach their minimum at about 6000 km distance. Beyond that, the curvature of the Earth bends the wave fronts to focus them again at a distance of about 12,000 km, where they can still cause considerable damage.

The relationship between wave speed (phase velocity) and depth of long surface waves in shallow water is given by the formula
c x c = g x d x (p2 - p1) / p2 or
c x c= g x d for water/air
where c= wave speed, g= acceleration of gravity (9.8066 m/s/s), d= wave depth (or upper layer depth, m), p2= density of water (=1) and p1= density of air (= 0.00125).
The formula states that wave speed increases with wave depth and the relative difference in density.
For an ocean depth of 4000m, a wave's celerity or speed would be about SQR(10 x 4000) = 200 m/s = 720 km/hr. Surface waves could theoretically travel much faster on larger planets, in media denser than water.


For deep water, the relationship between speed and wavelength is given by the formula:
l = g x t x t / (2 x pi)
l = t x c for all kinds of waves, substitute in above equation: t x c = g x t x t / (2 x pi)
c = g x t / (2 x pi) or t = c x 2 x pi / g or t = c x 0.641 (s)
where t= wave period (sec), f= wave frequency, l= wave length (m) and pi=3.1415...
to calculate c and l from wave period t (in sec): c = t x 1.56 m/s= t x 5.62 km/hr = t x 3.0 knot
l = 1.56 x t x t (metres)
Thus waves with a period of 10 seconds, travel at 56 km/hr with a wave length of about 156m. A 60 knot (110 km/hr) gale can produce in 24 hours waves with periods of 17 seconds and wave lengths of 450m. Such waves travel close to the wind's speed (97 km/hr). A tsunami travelling at 200 m/s has a wave period of 128 s, and a wave length of 25,600 m.
Wave speed, period and length with depthThese two diagrams show the relationships between wave speed and period for various depths (left), and wave length and period (right), for periodic, progressive surface waves. (Adapted from Van Dorn, 1974) Note that the term phase velocity is more precise than wave speed.

The period of waves is easy to measure using a stopwatch, whereas wave length and speed are not. In the left picture, the red line gives the linear relationship between wave speed and wave period. A 12 second swell in deep water travels at about 20m/s or 72 km/hr. From the red line in the right diagram, we can see that such swell has a wave length between crests of about 250m.
When the 12s swell enters 10m shallow water (follow the green curve for 10m), its speed will halve to 10m/s (left graph) and so will its wave length (right graph). But the height of the wave increases by a similar factor (not shown here).

The rougher the water becomes, the easier it is for the wind to transfer its energy. The waves become steep and choppy. Further away from the shore, the water's surface is not only stirred by the wind but also by waves arriving with the wind. These waves influence the motion of the water particles such that opposing movements gradually cancel out, whereas synchronising movements are enhanced. The waves start to become more rounded and harmonious. Depending on duration and distance (fetch), the waves develop into a fully developed sea.

Anyone familiar with the sea, knows that waves never assume a uniform, harmonious shape. Even when the wind has blown strictly from one direction only, the resulting water movement is made up of various waves, each with a different speed and height. Although some waves are small, most waves have a certain height and sometimes a wave occurs which is much higher.

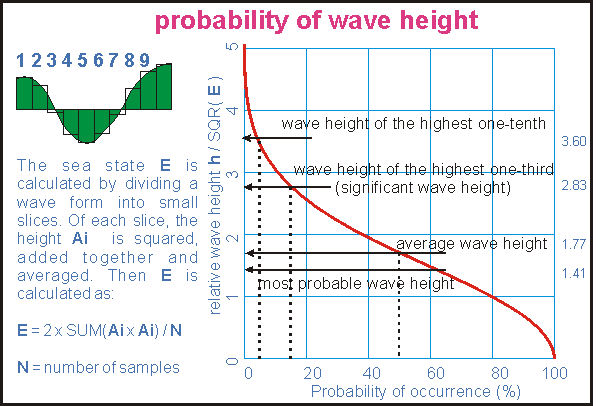
Wave height probabilityWhen trying to be more precise about waves, difficulties arise: how do we measure waves objectively? When is a wave a wave and should be counted? Scientists do this by introducing a value E which is derived from the energy component of the compound wave. In the left part of the drawing is shown how the value E is derived entirely mathematically from the shape of the wave. Instruments can also measure it precisely and objectively. The wave height is now proportional to the square root of E.
The sea state E is two times the average of the sum of the squared amplitudes of all wave samples.
The right part of the diagram illustrates the probability of waves exceeding a certain height. The vertical axis gives height relative to the square root of the average energy state of the sea: h / SQR( E ) . For understanding the graph, one can take the average wave height at 50% probability as reference.

Fifty percent of all waves exceed the average wave height, and an equal number are smaller. The highest one-tenth of all waves are twice as high as the average wave height (and four times more powerful). Towards the left, the probability curve keeps rising off the scale: one in 5000 waves is three times higher and so on. The significant wave height H3 is twice the most probable height and occurs about 15% or once in seven waves, hence the saying "Every seventh wave is highest". Click here for a larger version of this diagram.

Energy spectra for fully developed seasWhen the wind blows sufficiently long from the same direction, the waves it creates, reach maximum size, speed and period beyond a certain distance (fetch) from the shore. This is called a fully developed sea. Because the waves travel at speeds close to that of the wind, the wind is no longer able to transfer energy to them and the sea state has reached its maximum. In the picture the wave spectra of three different fully developed seas are shown. The bell curve for a 20 knot wind (green) is flat and low and has many high frequency components (wave periods 1-10 seconds). As the wind speed increases, the wave spectrum grows rapidly while also expanding to the low frequencies (to the right). Note how the bell curve rapidly cuts off for long wave periods, to the right. Compare the size of the red bell, produced by 40 knot winds, with that of the green bell, produced by winds of half that speed. The energy in the red bell is 16 times larger!
Important to remember is that the energy of the sea (maximum sea condition) increases very rapidly with wind speed, proportional to its fourth power. The amplitude of the waves increases to the third power of wind speed. This property makes storms so unexpectedly destructive.

The biggest waves on the planet are found where strong winds consistently blow in a constant direction. Such a place is found south of the Indian Ocean, at latitudes of -40º to -60º, as shown by the yellow and red colours on this satellite map. Waves here average 7m, with the occasional waves twice that height! Directly south of New Zealand, wave heights exceeding 5m are also normal. The lowest waves occur where wind speeds are lowest, around the equator, particularly where the wind's fetch is limited by islands, indicated by the pink colour on this map. However, in these places, the sea water warms up, causing the birth of tropical cyclones, typhoons or hurricanes, which may send large waves in all directions, particularly in the direction they are travelling.

For the complete series visit: Seafriends.org

Weather Story;

Typhoon Usagi is tracking closer to Japan and expect to hit the island today. To top that one, a small tsunami hit the Japanese Island of Hokkaido, no damage was reported. Tropical Storm Eric is still spinning in he eastern pacific and TS Chantel is off the NHC radar.


RS


Friday, July 27, 2007

WebExclusive- EPIRBs and the s/v Sean Seamour II - Part III

This is Part III in a series of reports on the malfunction of one of two EPIRBs (the ACR Globalfix" 406EPIRB) that was used during the rescue of the Seamour's crew.

We have reviewed what a EPIRB is and how it communicates between the vessel or person in trouble and we reviewed how the EPIRB communicates with the overhead satellites to the rescuers.

I have begun this story in this fashion because many of the visitors to this site are not mariners and its important for them to understand some of the technology and why when something like a EPIRB goes astray, its important to get to the bottom of the failure.

Today I want to not just revisit or go "back to the future" and remember just what took place prior to setting sail, but also what took place during the emergency.

To do this lets first revisit the final log of the s/v Sean Seamour II.

Cape Cod, May 12th 2007

This is the log of actions and events driven by the only subsequently named Sub-tropical Storm Andrea, leading to the sinking of s/v Sean Seamour II and the successful rescue of its entire crew on the early morning of May 7th 2007.

We departed from Green Cove Springs on the Saint Johns River in the early morning of May 2nd, 2007. Gibraltar was our prime destination with a planned stopover in the Azores for recommissioning and eventually fuel. The vessel, on its second crossing was fully prepared and some of the recent preparations done by Holland Marine and skipper with crew were as follows:

· Full rig check, navigation lights, new wind sensor, sheet and line check / replacement.

· New autopilot, stuffing box and shaft seal, house battery bank, racor fuel filtering system.

· Bottom paint, new rudder bearing and check, new auxiliary tiller, full engine maintenance.

· Recertification of life raft and check of GPIRB (good to November 2007), update and replacement of all security equipment (PFDs, flares, medical, etc).

Although paper charts were available for all planned destinations, with increased dependence on electronic navigational aids, two computers were programmed to handle both the MaxSea navigation software (version 12.5) as well as the Iridium satphone for weather data (MaxSea Chopper and OCENS). A full electronic systems checkout and burn trial was done during the days prior to departure.

For heavy weather and collision contingencies cutter rigged Sean Seamour II was equipped with two drogues (heavy and light), collision mat, auxiliary electric pump, as well as extensive power tools to enable repairs at sea with the 2.4kva inverter. Operational process and use of this equipment was discussed at length with the crew in anticipation. Other physical process contingencies such as lashing, closing seacocks, companionway doors, etc. were equally treated.

The 7 day weather GRIBs downloaded almost daily from April 25th onwards showed no inconsistencies, with the two high and two low pressure systems fairly balanced over the western Atlantic. Only the proximity of the two low pressure systems seemed to warrant surveillance as the May 5th GRIB would indicate with a flow increase from the N,NO from 20 to 35 knots focused towards coastal waters.

Already on a northerly course some 200 nautical miles out, I maintained our navigational plan with a N,NE heading until increased winds warranted a more easterly tack planned approximately 300 nautical miles north of Bermuda towards the Azores.

Wind force increased about eight hours earlier than expected and later shifted to the NE reaching well into the 60 knots range by early afternoon, then well beyond as the winds shifted. Considering that we were confronted with a sustained weather system that was quite different from the gulf stream squall lines we had weathered previous days, by mid afternoon I decided to take appropriate protective measures.

From our last known position approximately 217 nautical miles east of Cape Hatteras I reversed course, laying my largest drogue off the starboard stern while maintaining a quarter of the storm jib on the inner roller furl. This was designed to balance the boat's natural windage due in large part to its hard dodger and center cockpit structure.

By late afternoon the winds were sustained at well over 70 knots and seas were building fast. I estimate seas were well into 25 feet by dusk but after adding approximately 150 feet of drogue line the vessel handled smoothly over the next eight hours advancing with the seas at about 6 knots (SOG). By late evening the winds were sustained above 74 kts and a crew member recorded a peak of 85.5 kts.

Growing and irregular seas were the primary concern as in the very early hours of the morning the boat was increasingly struck by intermittent waves to its port side. Crew had to be positioned against the starboard side as both were tossed violently across the boat. Water began to accumulate seemingly fed through the stern engine-room air cowls. I believe in retrospect the goosenecks were insufficient with the pitch of larger waves as they were breaking onto the stern.

At approximately 02.45 hours we were violently knocked all the way down to starboard. It appears that the resulting angle and tension may have caused the drogue line to rupture (clean cut), perhaps as it rubbed against the same engine-room air-intake cowl positioned just below the cleat. The line was attached to the port side main winch then fed through the cleat where it was covered with anti-chaffing tape and lubricant. Before abandoning ship I noticed the protected part of the line was intact and extended beyond the cleat some five inches. Its position in the cleat rather than retracted from it also supports this theory.

After the knockdown I knew there was already structural damage and that we had lost control of the vessel. I pulled the GPIRB (registered to USCG documented Sean Seamour II) but I suspect that the old EPIRB from 1996 (Registered to USCG documented Lou Pantaï, but kept as the vessel was sold to an Italian national in 1998) might have been automatically launched first. I kept this unit as a redundancy latched in its housing on the port side of the hard dodger; it may have been ejected upon the first knockdown as Coast Guard Authorities questioned relatives with this vessel name versus Sean Seamour II. Herein lies a question that needs to be answered, hopefully it will be in light of the USCG report.

The GPIRB initially functioned but the strobe stopped and the intensity of the light diminished rapidly to the extent that I do not know if the Coast Guard received that signal. At the time were worried the unit was not emitting and I re initiated the unit twice. The unit sent for recertification with the life raft a few weeks prior had been returned from River Services. They had responded to Holland Marine that the unit was good until this coming November, functioned appropriately, and that the battery had an extra five year life expectancy. I will await reception of the Coast Guard report to find out if one or both signals was processed as all POCs were questioned regarding Lou Pantaï and not my current vessel Sean Seamour II (both vessels had been / in the case of Sean Seamour II is US Coast Guard documented).

As all communications excepting hand held VHF were down (SSB antennae on backstay, DSC VHF down and backup antennae inaccessible, Iridium soaked in roll, GPIRB not functioning, EPIRB seemingly lost to sea when hard dodger sheared) too much time was dedicated to hailing over the hand held VHFs and attempting to re-initialize the GPRIB). Had I cut the rig, dumped the 150 yards of chain in the bow, plugged the deck through mast passage and rerouted the rule pumps through the deck air cowl vents, we could have jump started the engine, deployed a second drogue with the sixty yards of stern anchor chain and regained control of the vessel. But that critical time window was lost

Expecting worse to come I re-lashed and locked all openings and the companionway. At 02:53hours we were struck violently again and began a roll to 180 degrees. As the vessel appeared to stabilize in this position I unlocked the companionway roof to exit an see where the life raft was. It had disappeared from its poop deck cradle which I could directly access as the helm and pedestal had been torn away. When I emerged to the surface against the boat's starboard (in righted port position) it began its second 180 degree roll. As it emerged the rig was almost longitudinal to the boat barely missing the stern arch. Spreaders were arrayed over cockpit and port side, mast cleanly bent at deck level, fore stays apparently torn away.

I ordered the crew to start all pumps. By their own volition they also cut out 2.5 gallon water bottles to enable physical bailing while I continued to locate the life raft. It finally appeared upside down under the rig. As its sea anchors and canopy lines were entangled in the rig and partially torn by one of the spreaders I decided to cut them away in an effort to save time and effort. I needed the crew below and had to manage the rig entanglement alone. This done I managed to move the unit forward and use its windward position to blow it over the bow to starboard, attaching it still upside down.

Below, water was being stabilized above the knees. The new higher positioned house battery bank was not shorted by the water level but the engine bank was flooded not enabling us to start the engine and pump from the bilge instead of the seacock. In retrospect this was not a loss as having to keep one of the companionway doors off for bailing and to route the Rule pump pipe, the water pouring in from here and the through-deck mast hole were no match for the impeller' volume. Plugging the mast passage was also not a solution as it was moving and hitting violently against the starboard head wall and was dangerous to try to cope with.

I knew the situation was desperate but it was still safer to stay aboard than to abandon ship, let alone in the dark any earlier than necessary. Estimating daylight at about 05:30 hours, we needed to hold on for at least another two hours. As the boat shifted in the waves it became increasingly vulnerable to flooding from breaking waves. One such wave at about 05:20 added about 18 inches of water, as the bow was now barely emerged these two factors triggered my decision to abandon ship. I exited first knowing that the raft was still upside down. In addition, some of the canopy lines still needed to be cut from the rig entanglement. In the precipitation the grab bag containing Iridium phone, VHF, GPS and all our personal and ship documents was lost.

As we boarded the now upturned raft it immediately flooded with the breaking waves and once unprotected from the wind by the hull structure was prone to turn over (no sea anchors nor canopy to roll over on). Hypothermia was already gaining upon one of my crew and myself and our efforts to right and re-enter the raft drained strength. Periods spent lying on the overturned raft exposed to the wind seemed to further weaken us.

Sean Seamour II sank a few minutes after we abandoned ship fully disappearing from view after the second wave crest.

We became aware of fixed wing overflight sometime between 06:00 and 07:00 hours and estimate that the Coast Guard helicopter arrived some time around 08:30 hours. As seemingly the most affected by hypothermia and almost unconscious the crew had me lifted out first. It was a perilous process during which Coast Guard AST2 Dazzo was himself injured (later to be hospitalized with us). The life raft was destroyed and abandoned by AST2 Dazzo as the third crew member was extracted. He also recouped the GPIRB which remained in USCG custody.

The emotions and admiration felt by my crew and myself to the dedication of this Coast Guard team is immeasurable, all the more so when hearing them comment on the severity and risk of the extraction, perhaps the worst they had seen in ten years (dixit SAT2 Dazzo). They claim to have measured 70 plus foot waves which from our perspective were mountains. We measured after the first knockdown and before loosing our rig winds still in excess of 72 knots.

Also to be commended are the medical teams involved, from our ambulatory transfer of custody from the rescue.

Redundancy;

"
My paper chart set was second to few recreational mariners, just there my replacement budget would total 3000$, even though I had comprehensive sets of electronic charts MapMedia, C-Map plus Maptech.

As a redundancy freak (ended up saving the crew) I usually had three of everything if not more (three sets of belts, ten fuel filters, extra propeller, extra running rigging) if Sean Seamour II ran well through the storm is in part due to to low waterline weighted with extra equipment, from sailrite sewing machine to heavy tools sets. Safety wise, I consider I had everything essential plus."

The Facts

As you can see the Master of the s/v Sean Seamour II painstakingly pre-planed for his voyage but to his luck his
redundancy of equipment paid off and save both his and his crews lives.. This is important to establish that the Master of the s//v Sean Seamour II did everything he should have done to ensure the safety of not just his vessel but his crew as well.

Now let's review some of the reported facts in this case and make note of, "
Re-certification of life raft and check of GPIRB (good to November 2007)." The ACR Globalfix"406EPIRB in question was re-certified as being in compliance and in good working order by a certified outside vendor.

The ACR Globalfix" 406EPIRB in question was purchased in October of 2002 and the UK vendor registered it with NOAA and supplied it to the s/v Sean Seamour II at the time still in the Mediterranean. This EPIRB was always kept in its cradle affixed to the inside of the companionway whenever the boat was in use.

Prior to leaving for the May crossing back to Europe the s/v Sean Seamour II had a shipyard send the EPIRB with the life raft for re-certification, the accredited service center informed the Master through the yard that the unit was fully operational and certified until next November.

The EPIRB started to function normally when initiated at about 02:45hours on the 7th, between the knockdown of the s/v Sean Seamour II, its crew and the EPIRB, it was put back in its cradle for safekeeping and accessibility should the need to abandon ship occur, less than 30 minutes later it reportedly ceased functioning.

The Coast Guard received the signal initially, but the hexadecimal code it received was that of another vessel in Alabama. The USCG never received a distress signal from the s/v Sean Seamour II as there appears to have been no Sean Seamour II vessel registered in their database.

Once the USCG ascertained that the ID code received was that of a non initiated EPIRB, under the principle that every EPIRB has a unique hexadecimal code plus the interruption of the signal, further search on this distress signal was abandoned.

Had the Master of the s/v Sean Seamour II not kept an 11 year old EPIRB (another ACR 406 with its original battery that functioned over ten hours) from one of his prior vessels the crew would be yet another set of lost at sea statistics and all of the above would not be known.

How this happened is now under investigation by the USCG and the Master of the Sean Seanour II. But the ramifications of such a failure do impact the entire maritime community.

As of this writing I cannot stress enough that all mariners must ensure that their EPIRBs are not just in operational condition, that the registration matches the face plate on their EPIRBs, but also that the registration actually matches the hexadecimal code in the NOAA database.

For the s/v Sean Seamour II Lessons Learned visit the maritime communities best of the best gCaptain.com

RS

Previous Posts;

WebExclusive EPIRBs and the s/v Sean Seamour II - Part II
EPIRBs and the s/v Sean Seamour II
NHC Report on Subtropical Storm Andrea
Cheating Death On The High Seas
The s/v Sean Seamour II & The Hatteras Trench
High Sea's Update On Sean Seamour II
The Story of the Sailing Vessel Sean Seamour II

Wednesday, July 25, 2007

More Heavy Weather

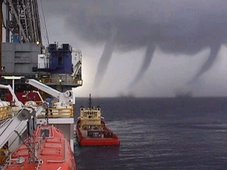
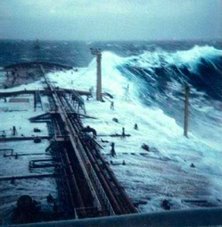
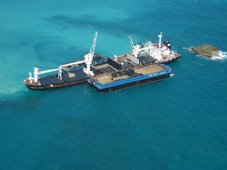
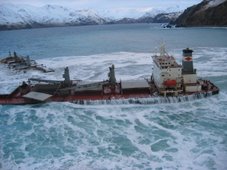
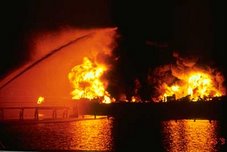
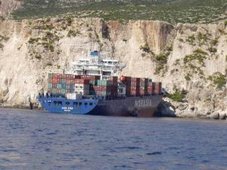
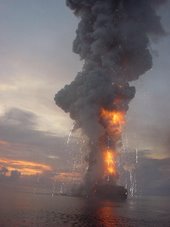
Once again, just to make a point. These pix's are ships (not boats) that encountered heavy seas. To be able to predict and "Forecasting Dangerous Waves" could very well reduce the loss of ships, cargo's and lives.

Imagine smaller vessels like the s/v Sean Seamour II and the s/v Flying Colours encountering waves that can do the damage that has been done to these ships.


Update on the
MSC NAPOLI.


Situation update regarding the MSC NAPOLI. The wreck has been separated into two, and the bow section has been towed a short distance offshore. Plans call for the stern section to be cut up in situ. The Council expressed concern over use of its shoreline to beach the vessel. The Council issued a second update stating that a decision is pending on which port to tow the bow to for recycling. The contract to remove the stern has been tendered. (7/23/07). Thanks Dennis!


RS

Monday, July 23, 2007

Forecasting Dangerous Waves

Lets meet another brand of storm chaser. Unlike the ones we see chasing tornado's, these storm chasers are chasing something we normally do not see right away and that causes havoc and hell on water.

We have talked about rogue and dangerous waves. I have and will continue to post some extraordinary pictures and videos of these waves and what they can do to ships, cargos and lives. Today I want to talk about the potential of forecasting dangerous waves. This would be indeed a ma jor advancement and benefit to both meteorology and the maritime communities.

The study of rogue waves is just getting underway. As I have noted Dr. Paul C. Liu of NOAA's Great Lakes Environmental Research Laboratory (GLERL) has been studying these waves. GLERL has also been studying wave forecasting for the Great Lakes Region.

According to GLERL, " This project is designed to develop and fully implement a system of computerized models that can simulate and predict the three-dimensional structure of currents, temperatures, water level fluctuations, wind waves, ice, and sediments in the Great Lakes. The project will integrate these models with the required observational data systems into a real-time coastal prediction system. The project will make the information developed from this system available in a useful format and in a timely fashion to National Weather Service (NWS web site) forecasters, coastal users and resource managers".

NOAA/NWS has both a Ocean Prediction Center and Wavewatch III . But neither of these services accurately report on waves inside the Gulfstream. Why is this important? Currents or "moving water" play a important role in both effecting and determining dangerous waves. Why don't they report? Well its complex, they can to some degree but the technology is also not there yet to satisfy the powers to be. Maybe NOAA should consider this rather than spend $100 million on public relations? So lets take a look at another concept being proposed in wave forecasting called the; Gulfstream Hazard Scale, by professional satellite Oceanographer Jenifer Clark and husband Meteorologist Dane Clark.

In a letter date 18 July 2007 to the Director of the National Centers for Environmental Prediction, the Clark's state, "
We have become increasingly alarmed by the large numbers of vessel sinkings and loss of life and property in the Gulfstream along the U.S. East Coast over the past several years. Just this spring, four more boats were sunk and four people were killed during an east coast storm that later became Tropical Storm Andrea -- even though this system was well forecast by NWS forecast models."

After talking with hundreds of mariners who have sailed in these waters over the years and recently completing a research report for a court trial involving the cruise liner "Norwegian Dawn", which was severely damaged with 400 passenger injuries in April 2005 after encountering 40-70 foot steep waves in the Gulfstream; we have concluded that mariners are not being adequately warned about the pote ntial danger when strong winds oppose strong ocean currents in the Gulfstream System (the main Gulfstream and eddies).

In the case of the Dawn, the Captain of that vessel testified that they had no idea they were sailing into those horrific conditions (see attached graphic). NWS forecasts indicated strong winds to 50 kts and significant wave heights to 27 feet, which were good forecasts outside the Gulfstream, but in the Gulfstream, seas were more than double that and these waves were much steeper and more difficult to navigate. Notations in the marine forecasts indicating "waves higher in the Gulfstream" were not very useful and mostly ignored since they are repeated in many offshore forecasts on a daily basis and contain no actionable data the mariner can use regarding the height or danger of these waves and their exact location.

Based on these and other cases we have examined, we feel that improvements are needed to alert mariners about specific threats about extreme and dangerous waves that exist in Gulfstream waters during these severe weather events,
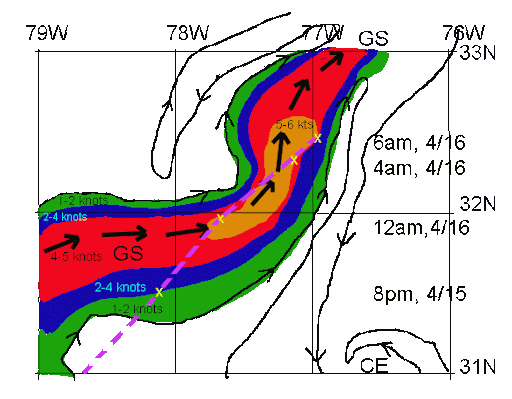
The highest risk area corresponds to the area of maximum ocean currents flowing northward (estimated at 5 kts) and winds recorded on the Dawn between 4-6AM on 4/16 at 50-55 kts blowing from the north. This is where an estimated 60-80 foot wave struck the Dawn and caused most of the damage and injuries. Wave heights were observed to be as high as 40-45 feet through the Gulfstream waters that night before the larger, steeper wave hit the ship.

Recent international research efforts to examine extreme wave events, termed MaxWave, have concluded that dangerous extreme waves are much more common than historically believed (and not uncommon, as the terms "freak wave" and "rogue wave" would imply). The studies further stated that current technology is incapable of precisely forecasting these extreme waves at present, but that there are areas around the world that are known "hot-spots" for extreme waves, like the Gulfstream, where strong winds often oppose strong ocean currents.
".


(Route ( chart above ) of the Norwegian Dawn (purple) on April 15-16, 2005 superimposed on Jenifer Clark's high resolution Gulfstream Analysis. The gulfstream maximum current is indicated by large black arrows, isolines of the estimated magnitudes of ocean currents are color coded and small arrows indicate the direction of flow of all ocean currents on this meso-scale chart.)

Therefore, using our experience and information from other mariners, we have developed a Gulfstream Hazard Scale which is similar to other environmental scales (tornados, hurricanes, river rafting, avalanches, etc.,) used to educate, alert and warn.

An important aspect of this scale is the increased potential for extreme waves, as the scale increases from Cat 0 to Cat 8. These are correlated to specific recommended responses to the risk, or threat levels.

This scale is a concept and has not been used operationally. Since it is subjective in nature, we expect that modifications may be needed before it could be used to develop warning products. The most important parameters required are detailed, real-time ocean surface currents in the Gulfstream area (Jenifer has been doing this on a daily basis for nearly 30 years) and real-time and forecasts of meso-scale surface winds (available from the NWS models).

We would like to sit down with your staff and discuss the possibilities of the NWS using this scale (or a modified version) in your operations, possibly on a trial basis next year. We envision a graphical product similar to the Mariner's 1-2-3 Rule for Tropical Storms, to warn mariners of high risk areas in the Gulfstream during severe conditions. This type of precise warni ng, containing risk levels for exact locations and times, should greatly improve the mariner's ability to understand and perceive the danger. This should in turn, motivate the Captain/Navigator to avoid these threat areas, resulting in reductions in life and property losses."

As you can read in the Clark's letter and as I have pointed out in some of my past posts, the Hatteras Trench region is a very well known maritime grave yard due to the storms fueled by the gulfstream and its winds. As we can read in their letter, we do have a hole in assisting mariners in forecasting these events. Some of the factors involved in the proposed Gulfstream Hazard Scale will include;

CAT - Categories 0-8, Risk - Threat to vessels from extreme or dangerous waves -- WD/OP/CUR - wind opposing the current. DUR - duration and fetch of the wind. SIG/WV/HGT - significant wave height (as per the international definition) -- an average maximum of the highest third of the waves in the wave spectrum, X/WAVS - Extreme wave potential, Marine/Guide - situation and recommended actions per category, (*) - generally taken as surface winds blowing against or quartering against the flow of the gulfstream currents (main stream or eddies).

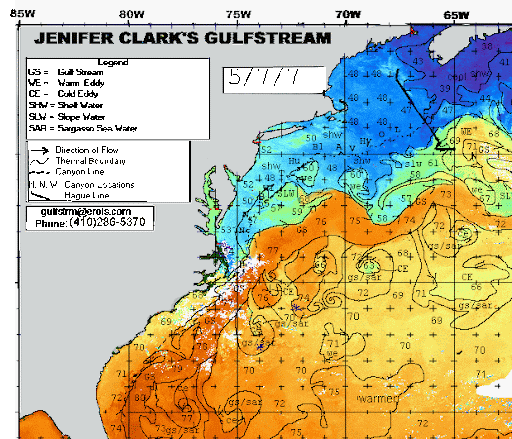
Note in the graphic above the stream encompasses both the main core (corps) and the eddies, something many mariners sometimes forget or just ignore. Now take a look at the cold eddies (below) during the 7 May 2007 Substropical storm andrea, when the s/v Sean Seamour II ran into trouble. Being able to predict the type of waves that the Sean Seamour II ran into, could have saved the sail boat from destruction and the crew from any hardships.


Also note the opposing winds to current from both northern quadrants . Remember strong winds in one direction with strong currents in the opposite direction can produce some very strong and active waves. Though some studies have shown that strong winds blowing from any directio n over gulfstream currents can also cause dangerous wave actions.

Its really this simple. Strong winds, strong currents, over time, means, very large waves. Its about being able to warn mariners in advance about these waves that can save ships, cargos and especially lives.

For further information on the Gulfstream Hazard Scale please visit,
Jenifer Clark's Gulfstream.

RS

Friday, July 20, 2007

WebExclusive: EPIRBs and the s/v Sean Seamour II - Part II

This is the second in a series of reports on the "reported" malfunction of the ACR 406 Rapidfix EPIRB that was used by the s/v Sean Seamour II when the sailboat ran in trouble during Subtropical Storm Andrea.

I say "reported" malfunction becuase as of this writing, no scientific or technical review has been completed. But we do know that something did in fact go wrong with the EPIRB.

In my last post we reviewed a statement from the Master of the s/v Sean Seamour II of what the crew experienced with one of two EPIRBs.

We reviewed what a EPIRB is and how it operates. Today we will visit how it communicates with satellites and how the satellites communicate with rescue personnel. It is important to understand what the system is and how it operates before we jump into the problem encountered by the crew of the s/v Sean Seanour II. No matter what the problem with the Sean Seamour II's EPIRB was. The system is a very valuable asset to the maritime and rescue community. Here are some statistics on just what this system has done.

To date according to COSPAS-SARSAT the system as of: June 29, 2007, the system is responsible for the rescue of 190 persons in the United States.


The breakdown is as follows:
Rescues at sea: 147 people rescued in 43 incidents. Aviation rescues: 14 people rescued in 11 incidents. PLB rescues: 29 people rescued in 14 incidents . Worldwide – Over 20,300 People Rescued (since 1982). United States – 5,586 People Rescued (since 1982). As you can see the system is extremely valuable.

So lets let NOAA Satellite Information Services explain the "search and rescue satellites".


Low-Earth Orbiting Search And Rescue (LEOSAR) Satellites

The keystone to the Cospas-Sarsat System are the low-earth orbiting (LEO) satellites from which the system takes its name. These satellites provide the ability to detect and locate 406 MHz alerts worldwide and 121.5 MHz alerts for about sixty percent of the world.

SARSAT is an instrument package flown aboard the NOAA series of environmental satellites operated by NOAA's National Environmental Satellite, Data and Information Service (NESDIS). These satellites orbit at an altitude of 528 miles and complete an orbit every 100 minutes. Their orbits are inclined 99 degrees from the equator. Typically, each satellite monitors the earth for various weather and climate data. Yet, each satellite also carries a Search and Rescue Repeater (SARR) which receives and retransmits 121.5 MHz, 243 MHz, and 406 MHz signals anytime the satellite is in view of a ground station. Also carried is a Search and Rescue Processor (SARP) which receives 406 MHz transmissions, provides measurements of the frequency and time, then retransmits this data in real-time and stores it aboard for later transmission. The satellite also stores each 406 MHz signal it receives and continuously downloads this data for up to 48 hours ensuring ground stations around the world receive it. That is, if the satellite was not in view of a ground station when it received a beacon signal, the next ground station that sees that satellite views will receive the data. This provides global coverage for 406 MHz distress signals. The SARR is provided by the Canadian Department of National Defence and the SARP is provided by the French Center National D'Etudes Spatiales (CNES).

The COSPAS instrument is carried aboard the NADEZHDA navigation satellite orbiting the Earth every 105 minutes at an altitude of 620 miles and an orbital inclination of 83 degrees. The COSPAS instrument was built by the former Soviet Union and continues to be operated by the Russian Federation. The only major difference between COSPAS and SARSAT is that the Russian satellites do not receive 243 MHz distress signals.

Geostationary Orbiting Search And Rescue (GEOSAR) Satellites

View from GOES-8As you can see from this image taken today from GOES-East, geostationary satellites are capable of continually viewing large areas of the Earth. These geostationary (GEO) satellites are also able to provide immediate alerting and identification of 406 MHz beacons. The GEO satellites are not able to use Doppler location processing since they have no relative motion between them and the emergency beacons. Therefore, they are not able to determine a location for a beacon. They can, however, provide immediate alerts. This is a valuable tool for SAR personnel since it allows them to begin their initial verification of the alert using the National 406 MHz Beacon Registration Database. Often this detective work yields a general location of the vessel or aircraft in distress and SAR assets can be readied or dispatched to that general area. Ideally, a SARSAT or COSPAS (LEO) satellite will fly over the beacon within the next hour and calculate a Doppler location which will be given to the SAR personnel who may already be enroute.

There is also one significant advantage with the GEOSAR constellation and that is the ability to use a GPS receiver with a 406 MHz beacon. Here’s how it works: specially made emergency beacons determine their location using a GPS receiver that is either integrated into the beacon (called a location protocol beacon) or fed by an external GPS receiver. This accurate location information (generally around a football field in size for positional accuracy) is then encoded into the 406 MHz signal that is transmitted by the beacon. The USMCC then receives that signal with the location and notifies the RCC accordingly. This information can often be derived in a matter of minutes! Since every second counts in reaching the scene of a distress this means that there is an increased chance of survival.

Without a doubt, the early warning capability of the GEOSAR constellation provides a valuable tool to increase the effectiveness of the Cospas-Sarsat system and, ultimately, save more lives ; First, a GPS-equipped beacon only works when the receiver has a clear view of the sky in order to permit the receiver to self-locate. Often times, conditions do not permit this which may either distort the positional accuracy or negate it altogether. Because of this, the Cospas-Sarsat System relies upon the Doppler locating effect as the primary means for locating a beacon. This process is able to overcome the limitations of a GPS unit and still generate a fairly accurate location…within a mile for positional accuracy. Secondly, the GEOSAR component only works if the beacon is registered with NOAA. Without registration, the RCCs are unable to react as quickly…and ultimately this may delay a SAR response should you be in an emergency. If you have a 406 MHz beacon and have not registered it, please do so by clicking here to access the National 406 MHz Registration Database.

For further information visit NOAAs Low-Earth Orbiting Search And Rescue (LEOSAR) Satellites page.

As you can see ther system has come a very long way since 1982 and it has experienced it share of problems. I am sure it will continue to have its problems while NOAA and
COSPAS-SARSAT continue its advances. It is my hope that these clitches are limited and without loss of life.

In Part III, we will go back to the future and visit with the pre-trip check of the s/v Sean Seamour II. One maritime note of interest. Thank to Dennis L. Bryant of
Holland & Knight LLP. UK – report on loss of lives due to large waves

The UK Marine Accident Investigation Branch (MAIB) released the joint report of the investigation undertaken by it and the Singapore Maritime and Port Authority (MPA) concerning the loss of two lives and one seriously injured crewmember on a tanker at Scapa Flow in the Orkney Islands on 11 November 2006. The tanker was outbound and four crewmembers were at the bow stowing loose mooring lines. Two large waves shipped over the bow. Three of the crewmembers were swept aft by the waves and incurred serious injuries. Two of the crewmembers died of their injuries. Investigation revealed that the two waves were not abnormal in the prevailing weather conditions. The master should have delayed sailing until the ship was secured for sea. The owners have amended their safety management system to include these recommendations. Report No. 16/2007 (7/18/07).

Have a great weekend!

RS

Previous Posts;

EPIRBs and the s/v Sean Seamour II
NHC Report on Subtropical Storm Andrea
Cheating Death On The High Seas
The s/v Sean Seamour II & The Hatteras Trench
High Sea's Update On Sean Seamour II
The Story of the Sailing Vessel Sean Seamour II


Thursday, July 19, 2007

Second in a Series; Subsea Atmospheres

To continue my series on the topic of subsea atmospheres. Not only will we focused on underwater weather systems of our oceans, but also how subsea atmosphere's extend and effect our bays.

To continue with my series here is a interesting article titled;

Predicting Underwater Weather,
By Michael W. Fincham,


There's a weather under the Bay, complete with high-pressure systems, low-pressure systems, several kinds of fronts and two kinds of slow-moving jet streams. Think of physical oceanographers as meteorologists of this underwater world. As they figure out the physics that controls the system, they should be able to predict the underwater weather more accurately - and take a lot of guesswork out of the forecasting game that so many people have to play.

Like a band of robots, CBOS buoys stand watch over the Bay. Some stay on station year after year, like the one off the Choptank River. Others come and go, moved to monitor a particular area, or pulled for fear of ice. Shown on the map are a string of buoys, some on station and some still proposed, waiting for the region's next investment in remote sensing. Artwork by Bill Boicourt.

Those were the selling points when Chesapeake Bay Observing System (CBOS) began - better physics and better forecasting. Over the last 15 years, Bill Boicourt has kept the system running despite hurricanes, lightning strikes, icy winters, vandalism and up-and-down funding cycles. Funding so far has come from more than three dozen sources. That's a lot of grant writing, but it has allowed Boicourt to keep buying new buoys, rebuilding old ones and restocking them with the latest in advanced sensing gear. In years of good funding he's had seven buoys taking data simultaneously.

Physics and forecasting, according to Boicourt, are still the selling points for CBOS-like systems expanded to cover the entire Bay and the Mid-Atlantic coastal waters. CBOS may soon morph into a newer, larger network of buoys and land-relay towers, capable of relaying even more real-time data about the weather above and below the Bay. The results could boost Chesapeake Bay science and help protect the Maryland economy.

If the future arrives according to Boicourt's forecast, CBOS could evolve into a cooperative regional system with more stable funding and more partners from academe, state and federal government, and private corporations. Players could include the Virginia Institute of Marine Science (VIMS), Old Dominion University, the Environmental Protection Agency, NOAA's National Ocean Service, the U.S. Navy, the U.S. Coast Guard, the Alliance for Coastal Technologies, and state agencies in Maryland and Virginia. The result would be a cooperative system, perhaps with a new name, that would provide real-time weather and water data from the head of the Bay all the way out onto the Continental Shelf.

There are even larger plans afloat. Congress is now considering a proposal for funding and expanding systems like CBOS and linking them together into a larger coastal network. That could mean more money and more acronyms. CBOS might be renamed and linked into something called IOOS (Integrated Ocean Observing System) or C-GOOS (Coastal Global Ocean Observing Systems), both of which would be part of an overall system called GOOS. Those plans drew a major endorsement last week in the Preliminary Report of the U.S. Commission on Ocean Policy.

The science prize is long-term data that oceanographers can use for figuring out the physics of the Bay and other coastal systems in greater detail. Better forecasts are also in those details, especially details about water temperatures, winds on the Bay, waves and currents that result from those winds.

The practical prizes are real-time products forecasting what the system is doing today and tomorrow. That's important for big commercial shippers who need to know water levels up in Baltimore Harbor and small recreational boaters who want to know wave conditions out on the mainstem. Real-time models of current flows would help with search-and-rescue missions and with emergency responses to natural disasters like storm surges and human accidents like oil spills and chemical leaks. CBOS can even help with Homeland Security with high-frequency radar that helps track large and small ships as they move about the Bay.

In my next installment we are going to talk about a new potential concept that will help warn mariners of large and dangerous waves. The Gulfstream Hazard Scale. Under development by a Oceanographer and Meteorologist, Jenifer and Dane Clark.

RS