 This is the long awaited report on Subtropical Storm Andrea by the NHC. I do have some problems and discrepancies with the report regarding the NHC findings and the data from both the s/v Sean Seamour II and the USCG.
Lets start with;
1. Why does the NHC not monitor and issue Tropical Weather Outlooks prior to June 1 the “official” start of the Atlantic hurricane season?
2. On the announced morning of the storm NWS/NHC stated that winds were NNE 20 to 25, shifting and strengthening to the NNO up to 35, mostly affecting coastal waters. In reality, by 1300 the s/v Sean Seamour II had winds at 60kts, by 1700 they were over 70 with wave structure regular but in excess of 25 feet. By 2100 the sail boat had sustained winds at 74kts, around 2300 hours their new and calibrated windvane read its max capacity at 85.5. The brunt of the system went over the sail boat around 0000 hours and began receding from there on.
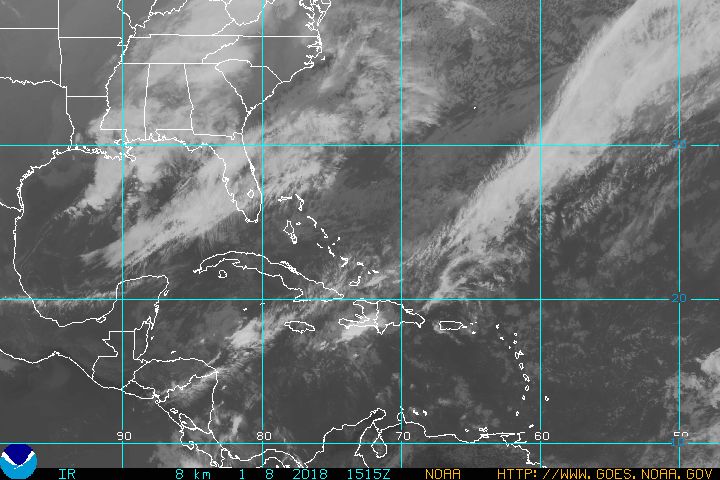
3. The first satellite data on 7 July 2007, timed 1547hours. Clearly shows the concentric of a tropical storm in formation, except that I believe when the sat image was taken it was in fact collapsing. Going back to data, at 0100 we still had sustained winds of around 74kts, slowly receding til the sailboat was knocked down at 0245 when wind measurement instruments recorded sustained winds above 70kts. In the sailboats location during Coast Guard extraction USCG rescue personnel claimed winds were still around 70kts around 0830.
4. Another factor that militates to the forming hurricane structure was the wave patterns change which clearly shifted about 30° between 2200hours on the 6th and 0200 on the 7th. Finally, wave structure was far too high for the wind structure that is vaguely address. Again to quote USCG personnel and others irregardless of the s/v Sean Seamour II observations, they had waves well over 70 feet.
5. On the issue of a rogue and or freak wave. I am holding back the reply until I can get confirmation of the NHC position and until I am sure both the NHC and myself have the correct wave data for the exact location when the s/v Sean Seamour II ran into trouble. I will update this as soon as the NHC replies.
These are major discrepancies between forecasts and actual's. I am awaiting a reply from the NHC. Now in all fairness to both NWS and NHC and they will tell you themselves that they forecast based on satellites, buoys, aircraft and computer models and that there can be higher readings in certain spots that they do not have information on. Meaning if NWS/NHC forecast winds at 35mph and waves at 15 feet. There is a possibility of actual's being much, much higher.
I will also add a note to say that QuikScat is mentioned often in the report and it appears that along with other overhead platforms QuikScat is indeed a valuable NWS/NHC asset.
The report...
Tropical Cyclone Report
Subtropical Storm Andrea
(AL012007)
9-11 May 2007
Jamie R. Rhome, Jack Beven, and Mark Willis
National Hurricane Center
1 June, 2007
Andrea formed off the southeast coast of the United States. It was the eighth earliest cyclone since 1851 and the first May cyclone since 1981.
Synoptic History
Andrea formed from a large extratropical cyclone that originated just offshore the mid-Atlantic United States coast on 6 May. This pre-Andrea cyclone deepened steadily that day, with the central pressure falling 16 mb in the 24-hour period ending at 0600 UTC 7 May. The cyclone initially possessed the classic signature of a fully mature extratropical system, with the associated cold front pushing through Florida and reaching as far south as Cuba on 7 May. By late on 7 May, the extratropical cyclone lost most of its baroclinic support and development ended. However, interaction of the low and strong high pressure to the north produced hurricane-force winds. The resulting large area of high winds, along with the slow motion of the extratropical low, generated large waves that impacted much of the coast of the southeastern United States and the Bahamas Islands. On 8 May, the low weakened and began drifting westward over progressively warmer waters in the western Atlantic. Along this track, vertical shear also decreased allowing for the generation of deeper convection around the center. By early on 9 May, convection had become symmetric about the low-level circulation center, the cyclone had lost all of its frontal and cold core structure, and the wind field had contracted. It is estimated that the system transformed into a subtropical cyclone by 0600 UTC 9 May while centered about 150 n mi east of Jacksonville, Florida. The “best track” chart of the subtropical cyclone’s path is given in Fig. 1, with the wind and pressure histories shown in Figs. 2 and 3, respectively. The best track positions and intensities are listed in Table 1.
The cyclone’s weakening continued during the subtropical phase, so Andrea’s peak intensity of 50 kt occurred at 0600 UTC 9 May. Initially, Andrea was trapped within the retrograding middle-to-upper-tropospheric cutoff low that had caused the pre-Andrea extratratropical cyclogenesis. This pattern resulted in relatively weak shear and a slow westward drift of the cyclone. By late on 9 May, Andrea came under the influence of strong northerly flow aloft on the western side of the upper-level low, resulting in increasing vertical shear and a slow southward motion. The increase in vertical shear displaced the strongest convection southeast of the low-level center, and Andrea weakened to a depression by 1200 UTC 10 May while centered about 95 n mi east-southeast of Jacksonville, Florida. Lacking significant deep convection, Andrea degenerated into a remnant low by 0000 UTC 11 May. The remnants of Andrea produced intermittent bursts of deep convection on 11 May while drifting southward just off the central coast of Florida. However, this activity was transient and never acquired sufficient organization for advisories to be re-initiated. The remnant low accelerated northeastward on 12-13 May ahead of an advancing cold front and later became absorbed within the frontal boundary by 14 May.
Meteorological Statistics
Observations in Andrea (Figs. 2 and 3) include satellite-based Herbert-Poteat and Dvorak technique intensity estimates from the Tropical Analysis and Forecast Branch (TAFB) and the Satellite Analysis Branch (SAB), as well as flight-level and dropwindsonde observations from two flights of the 53rd Weather Reconnaissance Squadron of the U. S. Air Force Reserve Command. Microwave satellite imagery from NOAA polar-orbiting satellites, the NASA Tropical Rainfall Measuring Mission (TRMM), the NASA QuikSCAT, and Defense Meteorological Satellite Program (DMSP) satellites were also useful in tracking Andrea. Ship reports of winds of tropical storm force associated with Andrea are given in Table 2, and selected surface observations from land stations and data buoys are given in Table 3. Andrea’s estimated peak intensity of 50 kt as a subtropical cyclone near 0600 UTC 9 May is based mainly on QuikSCAT data. The peak wind of 65 kt during the extratropical phase is based on buoy 41001 located, approximate 150 n mi east of Cape Hatteras, which reported a maximum sustained wind of 55 kt with a gust to 70 kt at 0500 UTC 7 May.
The basis for Andrea’s designation as a subtropical cyclone beginning 0600 UTC 9 May includes conventional satellite imagery, nearby ship observations, and remotely-sensed ocean surface vector winds from QuikSCAT. Dropwindsondes obtained from the Air Force Hurricane Hunter aircraft flown on the morning of 9 May indicate that Andrea had no appreciable horizontal thermal gradients (Figure 4a) and was beginning to acquire warm core characteristics. Specifically, the vertical wind profiles displayed in Figure 4a show winds decreasing with height east of the center, a pattern indicative of a warm core cyclone, with winds increasing with height west of the center, a pattern indicative of a cold core cyclone. Conventional satellite infrared satellite imagery showed convection had become symmetric about the circulation center (Figure 4b), and surface observations and ocean surface vector winds from QuikSCAT showed that the radius of strongest winds had contracted to within 60 n mi of the center (Figure 5).
Rainfall totals over the southeastern United States were generally less than 1 inch and no flooding was reported.
Casualty and Damage Statistics
There were no reports of deaths directly attributable to Andrea as a subtropical storm. However, the pre-Andrea extratropical cyclone was directly responsible for 6 deaths including all four crew members of the 54-foot sailing vessel Flying Colours whose last known location was off the coast of North Carolina on 7 May, a kayaker who died after being pulled out to sea near Seabrook Island, South Carolina on 8 May, and a surfer who drowned after being overtaken by a large wave near New Smyrna Beach, Florida on 9 May. Even though the drowning on 9 May occurred a few hours after the designation of Andrea as subtropical cyclone, most of the wave energy responsible for this death was generated during the pre-Andrea extratropical phase. Additionally, the U.S. Coast Guard rescued 9 people from three sailboats off the coast of North Carolina on 7 May.
Since Andrea never made landfall, most of the resulting damage was associated with the generation of large waves, higher than normal astronomical tides and associated coastal flooding, and associated beach erosion. Most of the significant damage occurred from North Carolina through Florida on 6-8 May as a result of very strong winds and waves associated with the pre-Andrea extratropical cyclone. A storm surge of 2-3 ft was reported in St. Johns and Flagler Counties in northeastern Florida.
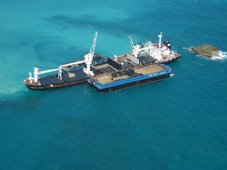
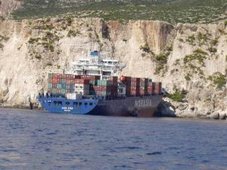
The vessel Paris Express encountered high seas in the Atlantic late on 6 May while en route from Savannah to Norfolk, resulting in the loss of 21 containers overboard. The resulting debris washed ashore from Cape Lookout, North Carolina northward to the Virginia border during the following days.
Forecast and Warning Critique
Since Tropical Weather Outlooks are not issued by the National Hurricane Center prior to June 1 (the “official” start of the Atlantic hurricane season), an assessment of genesis forecasts within that product is not possible. However, the pre-Andrea extratropical cyclone, including its associated hazards, was discussed by the National Hurricane Center within several Special Tropical Disturbance Statements beginning with the first issuance on the morning of 8 May.
A verification of official and guidance model track forecasts is given in Table 4. Average official track errors for Andrea were 22, 46, and 67 n mi for the 12, 24, and 36 h forecasts, respectively. For comparison, the average long-term official track errors are 35, 61, and 86 n mi for the 12, 24, and 36 h forecasts, respectively. A verification of official and guidance model intensity forecasts is given in Table 5. Average official intensity errors were 1, 5, and 1 kt for the 12, 24, and 36 h forecasts, respectively. For comparison, the average long-term official intensity errors are 6, 10, and 12 kt, respectively. Both the official track and intensity forecasts were below the average long-term errors.
You can read the rest of the NHC report including the charts and graphs here at the NHC website Subtropical Storm Andrea.
Previous Posts;
Cheating Death On The High Seas
The s/v Sean Seamour II & The Hatteras Trench
High Sea's Update On Sean Seamour II
The Story of the Sailing Vessel Sean Seamour II
RS


![[Valid RSS]](valid-rss.png "Validate my RSS feed")
No comments:
Post a Comment