 How to Read Sea Surface Temperature Images
Now we're going to give you all the information you need to know to become an expert at reading these images.
There are 3 simple steps:
- Image Navigation,
- Is that a cloud?
- How do I find favorable currents?
1) Navigation - One of the most important things to remember in life is not to believe everything you read. Well, with satellite images, you shouldn't believe everything you see. The satellites are 500 miles up in space and moving at speeds of around 20,000 mph. Because of this excessive speed and some tilt and roll in the satellite, the image isn't exactly in the right spot most of the time. How will you know that? You must look at the image very carefully.
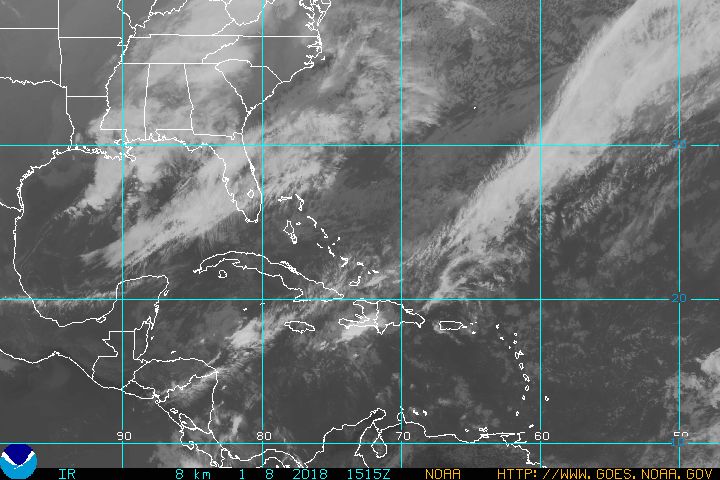
This SST image is not quite right. If you look at arrow A, you will see the coastline in the Cape May area. Now look carefully at the image itself. Notice that the deep red pattern is the same shape as the coast, but doesn't match up. This deep red area (hot temperature) is land. You can see that the coastline near point B should be matched up with the image near point C.
Now let's move the coastline to the correct spot.
 Now you can see what it should look like. Notice that when we move the coast, the Latitude/longitude grid also moves. As a web site user, you can't move the coast, but you can now estimate how much error there is in the image navigation when planning your boat trip.
A good thing to note: Land appears much warmer than the coastal water in this image because the satellite pass was taken on a hot summer afternoon. Land heats up a great deal on a hot day while water does not. Just think about when you walk across a beach on a hot day. The sand can burn your feet, but when you run down to the water, it's about the same temperature all day long. The opposite is true with night time images. Land can get very cool at night, while the ocean water will not change more than 4 or 5 degrees over a day.
These two images are a good example of this diurnal (night/day) heat difference.


2) Is that a cloud? - As I've already said, the satellites are 500 miles up in space. These satellites cannot see through clouds, so when there is a cloud above the earth, the satellite sees the temperature of the cloud and not the earth below it. Clouds are high up in the sky and are almost always cooler than the earth below. The farther you go up in altitude, the cooler it gets. Just ask a mountain climber.
So, knowing that clouds are cool, look at the image to the left. The areas marked a, b, and c are definitely clouds. They are so cold, they are off the temperature scale (white). Meanwhile, all of the ocean around them is green and yellow. Unless something very strange is going on, white areas in our imagery are RARELY water.


There is one other way of identifying a cloud. Clouds move rapidly over the earth at speeds between 15 to 50 mph. Water currents move at only 2-3 mph. So, the temperature patterns in the ocean should not change quickly. If you can compare two images that are less than 24 hours apart, you will know if a pattern is a cloud because it will not be in one of the two images. For example, look at these two images, specifically the areas marked D and E. In image 1, there is a cloud there (blue/purple), while in image 2 it has moved off to the east (marked cloud).
THE TEMPERATURE EXCEPTION - Upwelling - Sometimes during the summer, water from the ocean floor rises quickly from the bottom and can cool water temperatures 15 degrees in one day. These two images (area B) show one such upwelling event. They are only 20 hours apart, but the coastal water temperature dropped 10 degrees. In our area, these upwellings only occur along the coast. Find out more on Upwelling.


3) How do I find favorable currents? - If you are going out on the ocean in a sailboat, then you may know plenty about navigating coastal and deep water currents to your advantage. If not, think about it this way… If you were riding a bike down the street, would you get to your destination faster with the wind gusting in your face or at you back? We are going to do all we can to teach you how to keep that wind (currents) at your back so you can save time, money and boat fuel. It's a practical advantage, isn't it? So let's get to it.
Now, for the currents in shallow water, or water less than 600 feet (the depth of the continental shelf edge), we suggest you go to our CODAR Coastal Radar tutorial. Here we are going to give you a brief introduction on how to read a satellite image and determine the surface currents in deep water (i.e. waters more than 600 feet deep).

The image above is a simple view of the waters off of the Northeast US, showing the major current in the area known as the Gulf Stream (the red snakelike line in the picture). Here, the arrows indicate the direction of ocean currents. The Gulf Stream moves generally from west to east at about 4 knots. It contains areas called meander troughs, where it moves to the south and back to the north, and meander troughs which first move north, then back to the south again. If the trough gets too deep, it collapses and breaks off from the stream becoming a cold ring. If a crest gets too high, it too collapses and becomes a warm ring. Below is an animation showing how this happens. Warm rings (north of the Stream) rotate clockwise at about 2-3 knots while cold rings rotate counter clockwise at about 2-3 knots.

The final image is a piece of a surface temperature satellite image from our web site. We have overlaid arrows and text explaining the current speeds and directions. There are two additional features here. One is a frontal eddy, which is north of the stream and rotates counter clockwise. These small eddies stay attached to the northern edge of the stream and generally rotate at about 1 knot. The other is the arrow showing the counter current just north of the continental shelf edge (black line). This is the typical direction of surface current flow along the northern edge of the continental shelf.

All of our Sea Surface Temperature (SST) images come from NOAA/AVHRR satellites, which you can learn more about.
Maritime Notes
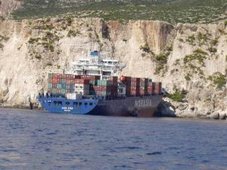
| UK. Ro-Ro ferry Riverdance to be dismantled on Blackpool beach | |
| Thursday, 10 April 2008 | |
| After a lengthy evaluation process, the owner of the Riverdance ferry, now lying on Blackpool beach, has produced plans to dismantle the ship in situ on the grounds that this represents the best option available in the interests of safety and protecting the environment. Hugh Shaw, the Secretary of State's Representative for Maritime Salvage and Intervention (SOSREP), has been involved throughout and has informed the owner that he has no objection to the plans. Weather permitting, it is estimated that the project will take approximately 12-14 weeks. Options examined ranged from righting the vessel (known as par-buckling), cutting up in situ or a combination of both. The preferred method will involve cargo, trailer and machinery removal, including any debris and any pollutants, whilst maintaining the integrity of the hull. The vessel will be stripped down internally until only the shell remains. The hull will then be cut into manageable pieces and transported for recycling. The Environment Group have been advised as well as Defra, the Environment Agency, the Marine and Fisheries Agency and Natural England. All parties (including Defra, the Environment Agency, the Environment Group, the Marine and Fisheries Agency and Natural England) recognise that, due to the uncertainty and technical difficulties of righting the vessel, cutting up in situ is now the best option. Until the new contract for demolition is awarded, SMIT Salvage remain on contract to carry out caretaking duties only. Hugh Shaw said : "I look forward to being able to brief officers and elected members of the local authorities to explain how and why the forthcoming works will be carried out. I also look forward to working closely with all interested organisations such as the police and local transport services to ensure that minimum disruption is caused to residents and local people." The original plan to reduce the list using tidal and internal buoyancy was abandoned due to the additional structural damage sustained during storms on 12 March. The vessel remains lying on the beach with a list of 100 + degrees. In addition the vessel continues to sink deeper into the sand. It is estimated that at least 4 metres of the bridge / wheelhouse is now under the sand. On Thursday 31 January 2008, the vessel's crew, on passage from Warren Point to Heysham, reported that she had developed a 40 degree list and was drifting towards the Lancashire coast. The vessel subsequently grounded at Cleveleys Beach, North Shore, Blackpool. | |
RS


![[Valid RSS]](valid-rss.png "Validate my RSS feed")