 Introduction
 The roughness of the oceans has important consequences for seafarers and coastal communities, and is linked to the global climate system through atmospheric circulation and winds. Satellite altimetry brought a global perspective on ocean wave climate (Chelton et al., 1981). With the accumulation of lengthy and carefully validated datasets from a number of satellite altimeters, it is now possible to evaluate the seasonality and inter-annual variability of wave climate globally to a resolution of the order of 100km.
Measuring Waves with Satellite Altimeters
By convention, significant wave height is defined to be four times the root-mean-square elevation of the sea surface, and is a standard statistic for the roughness of the sea surface. Satellite altimeters measure the roughness of the sea through the blurring of the leading edge of the reflected pulses by the uneven surface. Altimeter estimates of significant wave height are corrected by calibration with high-quality buoy data (Challenor and Cotton, 2001). Altimeters only measure the roughness of the sea in a small footprint (~10km diameter) immediately below the satellite. The data sampling is sparse, but sufficient to establish monthly mean significant wave heights on a 2o latitude by 2o longitude grid, or better if more than one satellite is operational. The gridded data sets are constructed from median values of individual "passes" across each grid box. Wave heights vary rapidly close to coasts. Also, the altimeter cannot measure waves if its footprint overlaps land. Therefore, the gridded altimeter datasets provide an offshore climatology only. Data along individual satellite passes can be analysed to extend analysis nearer shore, but even then the sizeable footprint of the altimeters is a limitation. Other methods are necessary to describe waves within 10km of the coastline.

Passes in the vicinity of United Kingdom
(Topex/Poseidon/Jason in Black, ERS-&2/Envisat in Red)
Global Wave Climatology
Average significant wave height can be measured monthly over the globe by satellite altimeter. Wave height varies regionally and seasonally, monthly means mostly varying between 1 metre and 5 metres. Generally, the sea is rougher at high latitudes (North and South) than in the tropics. Wave climate in the extra-tropical North Pacific and North Atlantic is especially seasonal with much rougher conditions in the northern (boreal) winter than in the summer. The Southern Ocean is roughest in the southern (austral) winter, but is very rough throughout the year. Nearer the equator, larger waves can be either swell propagating from higher latitudes, or can be the result of seasonal winds (e.g., monsoons and tropical storms). The Arabian Sea is particularly rough from June to August coinciding with the Southwest Monsoon.
The seasonal and regional wave climate can be summarised by fitting a sinusoidal function of annual period to the monthly mean significant wave heights for each grid square. At each location, the seasonality can be represented by the annual mean, the timing of the maximum wave height (phase of the sinusoid) and the range (twice the amplitude of the sinusoid).

Global Seasonality of Waves. Top: Annual Mean (metres); Middle: Annual Range (metres); Bottom: Phase (peak in months)
North Atlantic and British Isles
There is evidence that the North Atlantic Ocean grew considerably rougher between the 1960s and 1980s, during the age of the ocean weather ships, at least at a few isolated stations (Bacon and Carter, 1991). Is this natural variability or global warming? A new perspective is brought by analysis of satellite data.
The seasonality of wave climate around the British Isles is derived from monthly gridded altimeter measurements over five complete years (1993-1997). The ocean relatively rough throughout the year, while more sheltered regions, for example around south east England, are relatively calm. The seasonality varies slightly from region to region. For example, the spring tends to be slightly rougher than the autumn to the north west of the British Isles, but the reverse is generally true in the North Sea and the Southwest Approaches.

Seasonality of wave climate around the UK
The seasonal cycle is a fair representation of the average climate in the 1990s. However, there is also a great deal of variability about the mean in individual years. This is especially true during the winter months in the Atlantic and Atlantic margins, with monthly mean significant wave heights changing by up to a factor of two from one year to the next. The most obvious candidate as a source for this variability is the North Atlantic Oscillation (Hurrell, 1995), which has a widespread effect on many facets of climate, particularly in the months of December to March. We use gridded mean significant wave heights from these four calendar months in six consecutive winters, 92/93 -97/98. For each of the 24 months, "anomalies" are calculated by subtracting the mean seasonal cycle. Principal component methods are used to derive a spatial pattern of significant wave height anomalies whose time-dependent amplitudes are maximally correlated to an NAO index (Jones et al., 1997). A model for the anomalies is constructed by using the spatial pattern to calculate coefficients of a linear model relating the monthly anomaly to the monthly NAO index.

Inter-annual variability of wintertime wave climate
(above, spatial pattern of 1st eof; below, principal component (red crosses) and NAO Index (black squares)
The performance of the model is illustrated at a single location (57o-58oN, 8-10oW) on the edge of the Hebridean shelf. This location is typical of the region to the north west of the British Isles where inter-annual variability is greatest. Measured anomalies in excess of 2 metres (above or below the means of about 5 metres in each of the four calendar months) are recorded. These anomalies are well described by the relationship to the NAO. In other regions around the British Isles, the variability is lower and the model is less successful in describing this variability. However, the NAO is apparently a factor in determining wave climate throughout the area with the exception of the East Coast of England and Scotland.
Satellite altimetry provides a consistent coverage of wave climate around the British Isles. Previously, wave climatologies were constructed from measurements at a variety of sites and times (Draper, 1980 and 1991). The new climatology is based on measurements in the 1990s and reflects changes in wave climate since earlier decades (Bacon and Carter, 1991; Alcock and Rickards, 2001). Satellite data indicates that an upward trend in wave heights continued from the late 1980s into the early 1990s (Carter, 1999), but the behaviour during the 1990s was erratic. This behaviour can be explained by the NAO, which shifted towards more positive index values between the early 1960s and late 1990s before dramatically switching to its negative phase in the winter of 95/96. The relationship to the NAO is robust and can be used to hindcast the wave climate in much earlier times (Woolf et al., 2002).

Validation of NAO relationship at OWS Lima, extending back to the 1970s.

Behaviour of the NAO in recent decades (9-year running mean)

Hindcast of recent changes in wave height due to NAO.
Download papers on North Atlantic Wave Climate or UK Wave Climate from here
More on Hurricane Dean!
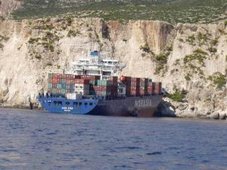
MASTER ENDEAVOUR driven aground by hurrican 'Dean', in Fort de France bay (Martinique - FWI), night 16-17 Aug 2007. The ship was anchored in the bay without crew, under arrest for drug smuggling.

RS


![[Valid RSS]](valid-rss.png "Validate my RSS feed")