Showing posts with label waves. Show all posts

Wednesday, November 26, 2008

When It Comes To Sea Level Changing Glaciers, New NASA Technique Measures Up

When It Comes To Sea Level Changing Glaciers, New NASA Technique Measures Up

ScienceDaily (Nov. 10, 2008) — A NASA-led research team has used satellite data to make the most precise measurements to date of changes in the mass of mountain glaciers in the Gulf of Alaska, a region expected to be a significant contributor to global sea level rise over the next 50-100 years.

Geophysicist Scott Luthcke of NASA's Goddard Space Flight Center, Greenbelt, Md., and colleagues knew from well-documented research that changes in the cryosphere – glaciers, ice caps, and other parts of the globe covered year-round by ice -- are a key source of most global sea level rise. Melting ice will also bring changes to freshwater resources and wildlife habitat. Knowing that such ice-covered areas are difficult to observe consistently, the team worked to develop a satellite-based method that could accurately quantify glacial mass changes across seasons and years, and even discern whether individual glacier regions are growing or shrinking.

The study's authors found that the annual ice mass lost from glaciers in the Gulf of Alaska has been 84 gigatons annually, about five times the average annual flow of the Colorado River through the Grand Canyon and equal to the entire amount of water in the Chesapeake Bay.

"The Gulf of Alaska region is 20 times smaller than the ice-covered area of Greenland, yet it contributes nearly half as much freshwater melt as Greenland and accounts for about 15 percent of present-day global sea level rise stemming from melting ice," said Luthcke, lead author of the study which will appear this week in the Journal of Glaciology. "Considering that the Gulf of Alaska makes such a disproportionate contribution, it is vital that we know more about the nature of glacial change there."

Luthcke and colleagues found a way to remotely measure the "mass balance" of a glacier; that is, the net annual difference between ice accumulation and ice loss. Past measurements of glacial mass balance in remote mountain ranges have been sparse or imprecise. Ground-based sensors can provide long-term data, but such data points are scattered due to the inaccessibility of many remote mountain ranges. Altimeters aboard aircraft can measure changes in the height of glaciers, but the sampling is sporadic because flights are relatively infrequent.

Glaciers in the coastal environments on the edge of the Arctic or Antarctic shed and gain mass rapidly, a high mass turnover that is particularly sensitive to climate change. Warming seas can accelerate the motion of tidewater glaciers, and melt water on glacial surfaces can flow to the floors of glaciers and serve as a lubricant as the ice slides toward the sea. The subsequent addition of freshwater to the ocean contributes to one of two sources of global sea level rise; "eustatic" rise resulting from melted ice in the form of freshwater, with the other source set off by "thermal expansion," sea level rise that occurs due to warming ocean temperatures.

The Goddard-led research team developed a new data analysis technique for NASA's Gravity Recovery and Climate Experiment (GRACE) mission. GRACE is made up of twin satellites that orbit Earth about 137 miles apart and 300 miles above Earth's surface. The positions of the two satellites change in response to variations in Earth's gravity field, which is stronger or weaker depending on the land or ice mass that they are flying over. Microwave ranging systems measure the distance between the two satellites down to the width of a human hair, so by measuring the change in the distance between the satellites over time, researchers can essentially "weigh" the changes in Gulf of Alaska glaciers.

Using data collected by the GRACE satellites from 2003-2007, as well as unique processing and analysis techniques, Luthcke and colleagues were able to measure the mass of the glaciers every 10 days across an area spanning 18,919 square miles, about the equivalent of Vermont and New Hampshire combined.

The team found the largest ice mass losses occurring in the Yakutat, Glacier Bay, and St. Elias regions. Those observations are consistent with recent studies from aircraft-based altimeters and other satellites.

"The consistent and direct measurement of ice-mass change made possible by the GRACE data and the analysis techniques applied in this study provide unprecedented observations that further our knowledge of the region's complex ice evolution," said Luthcke.

The most rapid glacial melt, according to Luthcke and colleagues, came in response to the summer heat wave of 2004, when the region's glaciers shed 374 gigatons of ice, or about 98 cubic miles of ice. In comparison, the record for Greenland ice melt was 500 gigatons, or about 131 cubic miles, during the summer of 2007.

"With such rapid change taking place in such a critical area, we need to be able to more reliably observe how these glaciers are responding," said Luthcke. "The direct measurement of ice-mass variation is important for improving our modeling capability and for ultimately predicting future changes."

WEATHER NOTE

Colors of the ocean make their way into a book

The compositions are simple: cresting waves, a stretch of sand, a field of sky. In some, glimmering sunlight highlights the ocean’s surface. In others, a protected cove is defined by water that ebbs and flows over sand. Gray cloudscapes sometimes threaten; the water might be rough.

Regardless, all the watercolor paintings seem serene, and project an air of solitude. No one inhabits these beaches—the viewer is one with the vista, alone, looking out to sea.

And this is exactly what artist Mike Solomon intended. It’s how he experiences the ocean while scanning sea conditions, waiting to surf. Waiting for the perfect time to put away his paints, grab his board and see how the shoreline view meshes with surfing reality.

The paintings can easily stand on their own. But closer examination brings a subtle surprise—there is writing across the bottom of the composition. At first, it seems like some sort of code: a numerical date, an actual time or time of day, a location. Notations on swell heights, air temperature, water temperature and weather-related information follow. The words are clinical, factual: a straight reporting of conditions. Then, unexpectedly, the personal.

A single sentence punctuates the text, changing the whole experience. The words can be simple like “(Michele’s Birthday)” or “A couple of guys out.” Sometimes the reference leans toward the poetic: “Strong offshores and shoulder high swell at low tide—all the elements baking in the sun.”

In some works, an unexpected twist concludes the text: “I sat and watched for a couple of hours but saw nothing worth enduring that cold for.” Or, “Claudia took her expensive sunglasses off and hid them in a crevice, never to be found again…” or “Xavier, the owner, offers me a beer.”

Yet other comments are more reflective: “They say Mike Diffenderfer used to surf the wave off the island. I would.” Or, “small surf can change on the tide—got it on the high a few days later—surprisingly good sometimes,” or “…No one out yet, just me with a few birds…” The cumulative effect changes the art and renders it more personal. Reading the small writing beneath the composition requires moving closer to the work, which the artist hopes will evoke the experience of feeling connected to the seascape and help viewers experience the artwork more intensely. These effects are of a piece with Mr. Solomon’s intentions.

“The paintings are deceptively simple,” he said. “They are memories of a specific time and place. The diaristic aspect is my way of bringing people closer to experiencing the ocean and the day the way that I did.”

Viewing a painting from close range also creates the sensation of “seeing” the view that lies beyond the 
parameters of the painting, Mr. Solomon explained.

“How we look at these paintings is important,” he said. “It’s not just what’s in the painting and what we see there. The work is about how we look at something.”

There’s no doubt the series of watercolor paintings is personal. The diaristic entries are part of it—but so are seascapes painted so that the emotional resonance of his experience radiates from the multi-layered composition.

The watercolor paintings take center stage in two manifestations. A series of 12 paintings is currently being shown in a solo show at John McWhinnie @ Glenn Horowitz Bookseller at 36 Newtown Lane in East Hampton. And 36 paintings are the substance of Mr. Solomon’s new book, “Meterological Watercolors,” with the title a nod to the weather and water notations that accompany each painting.

The 80-page book is self-created and will be available through the publisher, Blurb.com, in December, for $60. A foreword was written by Alicia G. Longwell, chief curator at the Parrish Art Museum. Signed copies are available now at Glenn Horowitz Bookseller, 87 Newtown Lane, East Hampton, for $75, and copies are also available through the artist’s website, www.mikesolomon.com.

The book contains artwork made from 1999 to August 2008, printed in chronological order. The paintings occupy the right-hand page with the text set on the opposite page. The foreword is the only introduction and explanation for the artwork. Some of the art is already part of collections held by private individuals or museums.

Watercolors are not Mr. Solomon’s primary method of expression. He is known more for abstract expressionist paintings and minimalist sculptures. His subject matter is often inspired by waves and the ocean, reflecting his lifelong love of surfing and the sea. He decided to create a series of watercolor paintings after uncovering a sketchbook from his 20s when he lived and surfed on the California coast.

Like the current series of paintings, his notebook artwork was rendered in watercolors while on site. After examining the combination of words and images, Mr. Solomon decided there was something that still spoke to him in the work. So he set out to create a new series of paintings.

Most of the compositions are painted on site. The painting is then developed and completed in his studio using multiple layers of watercolors. Sometimes the views are local; other times they capture foreign locales. The local site names were changed to protect beloved surfing spots.

Mr. Solomon’s aim is to conjure the mood and experience of watching a specific stretch of ocean at a specific time while gauging the surf conditions. Sometimes the mood is based on a two-hour span; other times a full day of observation is synthesized.

“It’s not a photograph,” Mr. Solomon said. “It’s not an exact replica—it’s a painting. I’m capturing a memory of that moment and that particular place.”

The exhibition, “Mike Solomon/Meteorological Watercolors,” remains on view through November 29 at John McWhinnie @ Glenn Horowitz Bookseller, 36 Newtown Lane, East Hampton. The gallery is open weekends. For information, call 324-5561 or visit Johnmcwhinne.com .

Further information on Mr. Solomon’s art can be found at www.mikesolomon.com. He is represented by Salomon Contemporary (no relation). The book can be ordered in December through blurb.com.

Have You Seen Our Hourly Weather Graphs?

Have you ever wanted to know what the forecast temperature is for 2 PM the next day? Or what the chance of rain is at 7 AM Friday morning? Did you know you can get hourly forecasts out to seven days on our website? You can! Weather forecast graphs, just like the one below, can be created and custom tailored to your location with just a few mouse clicks on our website!

hourly weather graph example


MARITIME NOTE

PhilNaRe's profit falls after paying for marine accident claims

MANILA, Philippines - The National Reinsurance Corp. of the Philippines (PhilNaRe) said profit fell by more than half as it paid claims to beneficiaries of marine accident victims, including those in the Princess of the Stars tragedy.

Net income for the third quarter of 2008 plunged 52 percent to P45.8 million from P95.6 million during the same period last year, the company said in a disclosure to the Philippine Stock Exchange (PSE).

Claims and losses from July to September reached P236.2 million, 73.4 percent more than last year’s P136.2 million, said PhilNaRe, which helps other firms share their insurance risks.

“Claims incurred in the current quarter include large marine losses including, among others, Princess of the Stars, Sea Bass Carriers, and Oceanic Container Line," the company said.

However, the company earned from foreign currency gains as its investments and other income reached P119.4 million during the three-month period, higher than the P82.1 million reported from July to September last year.

During the period, expenses climbed to P43 million, 45.67 percent more than the P30 million it spent last year. The company hiked employee benefits and salaries and paid taxes, licenses, and professional fees.

Earnings for the first nine months declined due to the fall in underwriting and investment income.

“Net income for the first three quarters was P238 million, P179 million or 43 percent lower than last year’s performance," the company said.

Meanwhile, expenses for the nine-month period went up by 37.5 percent to P123.6 million as against last year’s P89.9 million.

On the other hand, investment and other income declined by 6.6 percent to P350.4 million in the first nine months of 2007, the company said.

“The decline was largely due to the absence of trading opportunities during the period owing to the steep drop in the Philippine stock market," the company said. “Higher interest rates also negatively affected the valuation of the company’s investment portfolio, which is concentrated largely in fixed-income investments." - GMANews.TV

RS

Monday, October 29, 2007

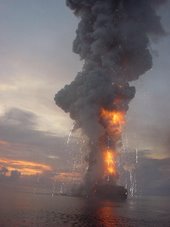
Large waves causes oil platform collision

Here we have a tragic AP story that shows us the power of mother nature and its ocean waves.

In this incident
the Usumacinta, a mobile, self-raising drilling rig, was set up next to the Kab 101 a light production platform preparing to drill a well close to the platform.

The force of the waves caused of the rig's "legs" to hit the valve assembly of the platform.

Presently this incident is under investigation by the Mexican Government.


Mexico finds 2 more victims of oil rig collision; death toll 21
Friday, October 26, 2007

Rescuers found the bodies of two oil workers in the Gulf of Mexico on Friday, bring to 21 the death toll after a drilling rig and an offshore platform collided earlier this week.

Mexican state oil company Petroleos Mexicanos said in a statement that it would continue to look for the last two missing workers. Most of the victims drowned after they abandoned the rig and their life rafts were swamped by high seas. Some 63 workers have been rescued, some after treading water for hours.

A total of 81 workers and five rescue personnel abandoned the subcontractor's drilling rig known as the Usumacinta on Tuesday, after it hit the Kab 101 light-production platform and damaged a valve.

Pemex said a team had reached the damaged platform Friday and would begin installing an emergency valve to inject fluid that would control a leaking underwater valve. Fumes from leaking gas and continued rough weather were making it hard to perform the repairs, however.

Pemex director Jesus Reyes Heroles said there would be an investigation of the wreck 20 miles (32 kilometers) off the coast of Tabasco state, during stormy weather that generated 80 mph (130 kph) winds and 25-foot (8-meter) waves.

Aerial photos of the damaged platform released by the Mexican government showed thin ribbons of black and brownish oil snaking across the Gulf waters around the structure. Pemex has said most of the leakage is gas, not oil.

The office of the attorney general for environmental protection said the leakage amounted to about 500 barrels of oil.

Pemex was also struggling with another spill, in the Jaltepec and Coatzacoalcos coastal rivers, where an estimated 10,000 barrels of oil products leaked from a land pipeline after a crack appeared on Wednesday.

Ranulfo Marquez, the assistant secretary of civil defense for the Gulf coast state of Veracruz, said containment booms were set up to try to stop the slick from flowing downstream. [end]

Here is another story from the Herald Times

And off the coast of North Korea...

N.Korean cargo ship capsizes, 22 missing-Xinhua
Sun Oct 28, 2007 11:38am EDT

BEIJING, Oct 28 (Reuters) - Twenty-two people are missing after a cargo ship registered in North Korea capsized in the Yellow Sea about four miles off China's eastern Shandong province on Sunday, Xinhua news agency reported.

An official with the provincial maritime bureau said strong winds were sweeping the area when the accident happened and only three of the 25 crew members had been saved, Xinhua said.
Local fishermen and police officers were organizing rescue efforts, the official said. It was not clear what cargo the ship was carrying.

RS


Wednesday, August 29, 2007

Fourth In A Series - Waves

Introduction

The roughness of the oceans has important consequences for seafarers and coastal communities, and is linked to the global climate system through atmospheric circulation and winds. Satellite altimetry brought a global perspective on ocean wave climate (Chelton et al., 1981). With the accumulation of lengthy and carefully validated datasets from a number of satellite altimeters, it is now possible to evaluate the seasonality and inter-annual variability of wave climate globally to a resolution of the order of 100km.

Measuring Waves with Satellite Altimeters

By convention, significant wave height is defined to be four times the root-mean-square elevation of the sea surface, and is a standard statistic for the roughness of the sea surface. Satellite altimeters measure the roughness of the sea through the blurring of the leading edge of the reflected pulses by the uneven surface. Altimeter estimates of significant wave height are corrected by calibration with high-quality buoy data (Challenor and Cotton, 2001). Altimeters only measure the roughness of the sea in a small footprint (~10km diameter) immediately below the satellite. The data sampling is sparse, but sufficient to establish monthly mean significant wave heights on a 2o latitude by 2o longitude grid, or better if more than one satellite is operational. The gridded data sets are constructed from median values of individual "passes" across each grid box. Wave heights vary rapidly close to coasts. Also, the altimeter cannot measure waves if its footprint overlaps land. Therefore, the gridded altimeter datasets provide an offshore climatology only. Data along individual satellite passes can be analysed to extend analysis nearer shore, but even then the sizeable footprint of the altimeters is a limitation. Other methods are necessary to describe waves within 10km of the coastline.

Passes in the vicinity of United Kingdom

(Topex/Poseidon/Jason in Black, ERS-&2/Envisat in Red)

Global Wave Climatology

Average significant wave height can be measured monthly over the globe by satellite altimeter. Wave height varies regionally and seasonally, monthly means mostly varying between 1 metre and 5 metres. Generally, the sea is rougher at high latitudes (North and South) than in the tropics. Wave climate in the extra-tropical North Pacific and North Atlantic is especially seasonal with much rougher conditions in the northern (boreal) winter than in the summer. The Southern Ocean is roughest in the southern (austral) winter, but is very rough throughout the year. Nearer the equator, larger waves can be either swell propagating from higher latitudes, or can be the result of seasonal winds (e.g., monsoons and tropical storms). The Arabian Sea is particularly rough from June to August coinciding with the Southwest Monsoon.

The seasonal and regional wave climate can be summarised by fitting a sinusoidal function of annual period to the monthly mean significant wave heights for each grid square. At each location, the seasonality can be represented by the annual mean, the timing of the maximum wave height (phase of the sinusoid) and the range (twice the amplitude of the sinusoid).

Global Seasonality of Waves. Top: Annual Mean (metres); Middle: Annual Range (metres); Bottom: Phase (peak in months)

North Atlantic and British Isles

There is evidence that the North Atlantic Ocean grew considerably rougher between the 1960s and 1980s, during the age of the ocean weather ships, at least at a few isolated stations (Bacon and Carter, 1991). Is this natural variability or global warming? A new perspective is brought by analysis of satellite data.

The seasonality of wave climate around the British Isles is derived from monthly gridded altimeter measurements over five complete years (1993-1997). The ocean relatively rough throughout the year, while more sheltered regions, for example around south east England, are relatively calm. The seasonality varies slightly from region to region. For example, the spring tends to be slightly rougher than the autumn to the north west of the British Isles, but the reverse is generally true in the North Sea and the Southwest Approaches.

Seasonality of wave climate around the UK

The seasonal cycle is a fair representation of the average climate in the 1990s. However, there is also a great deal of variability about the mean in individual years. This is especially true during the winter months in the Atlantic and Atlantic margins, with monthly mean significant wave heights changing by up to a factor of two from one year to the next. The most obvious candidate as a source for this variability is the North Atlantic Oscillation (Hurrell, 1995), which has a widespread effect on many facets of climate, particularly in the months of December to March. We use gridded mean significant wave heights from these four calendar months in six consecutive winters, 92/93 -97/98. For each of the 24 months, "anomalies" are calculated by subtracting the mean seasonal cycle. Principal component methods are used to derive a spatial pattern of significant wave height anomalies whose time-dependent amplitudes are maximally correlated to an NAO index (Jones et al., 1997). A model for the anomalies is constructed by using the spatial pattern to calculate coefficients of a linear model relating the monthly anomaly to the monthly NAO index.

Inter-annual variability of wintertime wave climate

(above, spatial pattern of 1st eof; below, principal component (red crosses) and NAO Index (black squares)

The performance of the model is illustrated at a single location (57o-58oN, 8-10oW) on the edge of the Hebridean shelf. This location is typical of the region to the north west of the British Isles where inter-annual variability is greatest. Measured anomalies in excess of 2 metres (above or below the means of about 5 metres in each of the four calendar months) are recorded. These anomalies are well described by the relationship to the NAO. In other regions around the British Isles, the variability is lower and the model is less successful in describing this variability. However, the NAO is apparently a factor in determining wave climate throughout the area with the exception of the East Coast of England and Scotland.

Satellite altimetry provides a consistent coverage of wave climate around the British Isles. Previously, wave climatologies were constructed from measurements at a variety of sites and times (Draper, 1980 and 1991). The new climatology is based on measurements in the 1990s and reflects changes in wave climate since earlier decades (Bacon and Carter, 1991; Alcock and Rickards, 2001). Satellite data indicates that an upward trend in wave heights continued from the late 1980s into the early 1990s (Carter, 1999), but the behaviour during the 1990s was erratic. This behaviour can be explained by the NAO, which shifted towards more positive index values between the early 1960s and late 1990s before dramatically switching to its negative phase in the winter of 95/96. The relationship to the NAO is robust and can be used to hindcast the wave climate in much earlier times (Woolf et al., 2002).

Validation of NAO relationship at OWS Lima, extending back to the 1970s.

Behaviour of the NAO in recent decades (9-year running mean)

Hindcast of recent changes in wave height due to NAO.

Download papers on North Atlantic Wave Climate or UK Wave Climate from here


More on Hurricane Dean!

MASTER ENDEAVOUR driven aground by hurrican 'Dean', in Fort de France bay (Martinique - FWI), night 16-17 Aug 2007. The ship was anchored in the bay without crew, under arrest for drug smuggling.


RS

Tuesday, August 28, 2007

The M/V Aratere Incident

The Maritime New Zealand report of the M/V Aratere incident has just been released. while it was determined that the vessel was constructed to take the large wave pounding.

I want you to note the damage done to this vessel, its crew and passengers.

Imagine a 44 ft sailboat like the Sean Seamour II taking these waves?

New Zealand – report re cargo shift on ferry

Maritime New Zealand issued the report of its investigation into the incident onboard a passenger ferry that experienced heavy rolling and cargo shifts during severe weather. Four passengers and one crewmember were injured and there was significant cargo damage. The report recommends, among other things, further review of weather parameters for Cook Strait crossings and improved training of bridge personnel for ship handling in heavy weather. (Report pdf Aratere 8/23/07).

The MV Aratere is a roll-on roll-off train ferry in service for Interislander in New Zealand. The ferry was built for Tranz Rail, now Toll NZ, in 1998 to replace the aging MV Aratika. The name Aratere means "Quick Path" in the Māori language.

The ships particulars include: Year Built 1998. Builder: Astillero Barreras, Spain. Introduced: 1999. Gross tonnage: 12,300 t. Flag: New Zealand. Passenger capacity: 369. Rail wagon capacity: 60 (425 m). Car capacity: 230. Length: 150m. Breadth: 20.25m. Maximum speed: 19.5kt. Engines: 2x Wartsila type 8L32 diesel engines, each producing 3,680 kW.

We previewed this vessel the Strait Shipping Company "Suilvan" back on June 8, 2007 with a post titled "Another Plane Of View". Speaking about how large waves effect large ships with this video from a shore-base view.


Aratere heavy weather report released
Media release

DATE

STRICTLY EMBARGOED UNTIL NOON 23 AUGUST 2007

Aratere heavy weather report released


Improvements have been made to the way Cook Strait ferries are operated in rough weather following a thorough investigation into the heavy rolling of the Aratere on 3 March 2006.

In releasing Maritime New Zealand’s final report into the incident today (Thursday 23 August), Director Catherine Taylor said while the vessel was capable of withstanding the heavy rolls it encountered, all parties involved accepted that passengers should not have been put in such a position.

“Passenger safety is Maritime New Zealand’s number one priority. This is why we’ve conducted a rigorous investigation, which contains 14 safety recommendations that have already been implemented to improve heavy weather sailing in Cook Strait. This is to ensure that passengers aren’t placed in a situation like this again.”

The report found that during the voyage in rough seas, the Aratere rolled twice to about 50 degrees, with a third roll of approximately 30 degrees occurring when an attempt was made to turn the vessel into the weather.

“Maritime New Zealand considers that although the Aratere itself was sound and was capable of handling the rough seas it encountered, this was still a very serious incident which was understandably very upsetting and uncomfortable for many on board.”

The heavy rolling caused minor injuries to five of the 381 people on board and caused some cargo to break free, damaging rail and vehicular freight. The Aratere arrived safely in Picton several hours later. Other vessels operating in Cook Strait at the same time completed their voyages without incident.

Ms Taylor said MNZ’s final report had considered a wealth of evidence, including eye witness accounts, the advice of overseas experts and technical information from the ship’s voyage data recording instruments. “Based on this evidence, MNZ has concluded that a combination of factors caused the Aratere to roll heavily. While the heavy rolling would have been alarming for those on board, the technical evidence we received appears to conflict with reports that the ship was in serious danger.”

Ms Taylor said the final report also considered the seamanship displayed during the voyage, including the actions of the master and bridge team, as well as issues relating to the cargo lashing system.

“While the report found that the decision to sail was reasonable based on the information available at the time, both Interislander and Maritime New Zealand consider that teamwork on the bridge following the first heavy rolling incident was not functioning as effectively as it should have been.

“Both organisations have been working closely together to address this issue and have implemented a number of safety recommendations.”

Among the actions taken by Interislander is a full review of decision-making relating to rough weather crossings, additional training for ferry masters and crew, improvements to cargo lashing systems and significant investment in overhauling and upgrading the ferries Aratere, Arahura and Kaitaki. Maritime New Zealand has also improved its process for distributing information to ferry companies.

“The purpose of all incident investigations is for the parties involved to learn from them to improve safety, and this is exactly what has happened in this case. Maritime New Zealand’s number one priority is, as always public safety, and we will continue to work with all ferry operators to ensure that the Cook Strait remains a safe place for all to travel.”

Ms Taylor said the report commended the Aratere’s on-board staff for the level of care they displayed towards the passengers during the voyage, and the way in which they kept them informed of the developing situation.

The Transport Accident Investigation Commission also today released its final report into the incident.

ENDS


Safety Recommendations implemented following 3 March 2006 incident

1. It is recommended that Maritime New Zealand:

- Facilitates discussions between the Interislander, Strait Shipping, Wellington Regional Council, Marlborough Regional Council, and the Wellington and Marlborough Harbourmasters through the Cook Strait Ferry Review. These discussions should consider appropriate weather parameters for ferry sailings, including the need for harbourmasters to be consulted on the appropriateness of ferries sailing when wave heights and wind speeds reach certain levels. These discussions have already occurred and are ongoing.

- Continues to conduct ongoing audits of Bridge Resource Management, navigational practice and the lashing system on Aratere and examination of cargo manifests of rail wagons carried, for compliance with the amended Cargo Securing Manual. Ongoing.

- Conducts ongoing audits of all Cook Strait ferries to ensure that trucks are lashed in accordance with the cargo lashing manual. Ongoing.

- Conducts ongoing audits to monitor the implementation of corrective actions proposed by Interislander. Ongoing.

- Reviews its procedures for promulgating safety information, including pertinent IMO circulars. Completed.

2. It is recommended that Interislander:

- Reviews and documents its procedures for downloading VDR information following an accident or incident and ensures that ships’ masters and officers have the knowledge and ability to do so. Completed.

- Ensures that helmspersons on its vessels are adequately trained and practised so that they can competently steer the vessel in all weather conditions. Completed.

- Conducts random, unannounced, command assessments of its masters and officers to check their knowledge of the equipment they use and its limitations, and knowledge of, and compliance with, company procedures. Ongoing.

- Formalises a policy that Masters and, if appropriate, officers and crew, are stood down from duty following a significant accident or incident for recovery, and to ensure their availability for internal and external investigations. Completed.

- Resolves confusion over optimum rudder angles, in particular the operating conditions applicable to high-lift rudders. Completed.

- In conjunction with its ships’ masters, review the use of stabilisers when running down weather in heavy weather conditions, and in particular when there is a risk that the vessel may be subject to surf riding. Completed.

- Require masters and deck officers to undergo initial training in heavy weather ship handling followed by regular refresher training. Completed.

- Extend the simulation modelling being carried out by naval architects into ship/tide/weather interactions in the Cook Strait, to include interaction between the ship and conditions likely to be experienced in the entrance channel to Wellington Harbour and the eastern entrance to Tory Channel in severe southerly weather. Completed.

- Provide MNZ with the results of any internal investigation and follow up action as a matter of course, rather than being required to do so. Ongoing.


ENDS

Weather Story ...Well here is the rain totals for Chicago from from July through August by Northern Illinois University...

After a major event (we're still awaiting official word from the USGS and hydrologists on what type of event this was, IE, one in a 50 or 100 year flood, etc), people have been asking if that was a record rainfall we had last week.Rockford and Madison, WI have had their wettest Augusts ever, so how are we doing?

To answer that question, let's look at July and August 2007 up until
today.

July 2007: 8.20"

August 2007 (so far): 11.64"


July-August 2007 combined rainfall total: 19.84"

The top 4 wettest Augusts ever:
1. 14.23" -1987
2. 11.64" -2007

3. 11.17" -1900

4. 10.94" -1937


The top wettest July-August combined totals ever:
20.14" -1987 19.84" -2007 17.58" -1996 16.77" -1900

We still have essentially 3 more days to go to add to the totals. There is
a possibility that if we get .30" of rain Tuesday evening into Wednesday, we would tie the wettest July-August combined ever.

Finally, I had two brief periods to go out and take a few pictures of the
flooding here on campus on Friday.

I took these around Barsema Hall,
Gilbert Hall/Music building, Castle Drive, inbetween Faraday and Faraday West, and from my perch here on Davis Hall (the silly flash wouldn't shutoff on those pictures---sorry about that): http://weather.admin.niu.edu/floodof2007/ But still, some good pix in there nonetheless.

Yes, that's an upset beaver
in there on Castle Drive, annoyed that his dam is now somewhere on the Mississippi River. He walked right in front of me, but I didn't have my camera ready at that moment.

Also, Dr. Walker Ashley, a meteorology professor here at NIU, who had more
time, got a considerably better variety and angle of shots: http://thetae.blogspot.com

Thanks to Dave Changnon for the help in acquiring the data, and to the
220,000 on and off-campus visitors *each day* between Wednesday and Friday of last week who used our site, setting a usage record in our nearly 9 year history!

Gilbert Sebenste
(My opinions only!)
Staff Meteorologist, Northern Illinois University
E-mail: sebenste@weather.admin.niu.edu
web: http://weather.admin.niu.edu


RS

Monday, August 6, 2007

2007 inaugural IMO Award for Exceptional Bravery at Sea

2007 inaugural IMO Award for Exceptional Bravery at Sea to be awarded to Searose G seafarers for dramatic rescue of Teklivka crew

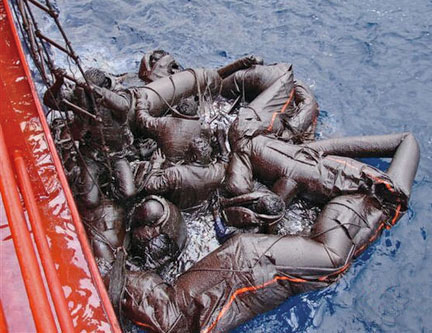
( Left, Rescued Tanker Crew Covered in Oil Photo Courtesy Searose G)

Council - 98th session: 25-29 June 2007

Two officers from the 83,155 dwt Bahamas-registered oil/bulk ore carrier Searose G have been selected to receive the inaugural 2007 IMO Award for Exceptional Bravery at Sea, in recognition of their part in a dramatic rescue in severe weather.

The IMO Council, at its 98th session in London, agreed with two Panels of international assessors and judges that Second Officer Mustafa Topiwala of the Searose G and Captain Zvonimir Ostric (who was on the vessel as onboard trainer at the time of the incident) had displayed exceptional bravery in the rescue of the remaining survivors from the sunken vessel Teklivka, in the eastern Mediterranean, in March 2006. They were nominated by the Bahamas and by the International Federation of Shipmasters' Associations (IFSMA).

The Bahamas-registered Searose G was on passage through the Mediterranean, bound for the Suez Canal, when it responded to a distress call from the Maltese-flagged Teklivka, which was sinking 50 miles south in gale force winds. The Teklivka had sunk when the Searose G reached the scene but a dramatic rescue ensued, with Searose G rescuing nine crew and another vessel picking up three crew members. Tragically, three crew members of the Teklivka were lost.

The assessment and judging panels considered that Second Officer Topiwala and Captain Ostric placed their own lives in jeopardy, even though they were not trained professional rescuers, by undertaking acts that went well beyond the scope of their normal duties. They left the comparative safety of their ship, descending to a liferaft filled with oil and water. Second Officer Topiwala then entered the sea, in extremely hazardous weather conditions, during the rescue.

Mr. Topiwala and Captain Ostric will be invited to receive the award at a special ceremony to be held during the IMO Assembly, to be held from 19 to 30 November 2007 in London. They will each receive a medal and a certificate citing the act of exceptional bravery performed.

"I am delighted that the assessment and judging of nominations for this inaugural Bravery Award has met the high expectations of all concerned and that we have, in Second Officer Mustafa Topiwala and Captain Zvonimir Ostric, truly exemplary and meritorious winners," IMO Secretary-General Mr. Efthimios E. Mitropoulos said. "I congratulate them both wholeheartedly and look forward to doing so personally, at the Award ceremony during the IMO Assembly."

Mr. Mitropoulos noted that the Award was launched "so that the international maritime community could honour the very best of human qualities - bravery, courage, selflessness - and there is no doubt that all other nominees for the 2007 Award have also shown just that and are deserving of our respect."

The IMO Council agreed with the recommendations of the assessment and judging panels that the following nominees, the first two of which were also shortlisted for the Award, should be recognized by receiving certificates citing their respective acts of bravery:

  • The Hong Kong Government Flying Service, nominated by China, for courageous actions that went well above those expected of a professional rescue service. The assessment and judging panels considered that members of the Hong Kong Government Flying Service clearly risked their own lives to rescue 91 crew members of the vessel Wing on IV and the barge Hai Yang Shi You 298 (in August 2006) during the course of three consecutive aircraft/helicopter operations carried out in severe typhoon weather conditions, at some 170km and 132km southwest of Hong Kong, China, respectively.
  • Captain Xufeng Zu of the diving squad of Quinghuangdao Base of Beihai Rescue Bureau of China Rescue and Salvage (CRS). Captain Xufeng Zu was nominated by the International Lifeboat Federation (ILF) for a selfless act of bravery in August 2006. During the course of a professional operation involving two consecutive dives to locate and rescue the crew from the upturned hull of the capsized bulk carrier Fu Hua 1 (41 miles off Quinghuangdao, China), Captain Zu gave up his own breathing equipment, with no guarantee that he would survive, thereby placing his own life at risk so that two remaining survivors could be saved, before he himself was able to leave the stricken vessel.
  • Dr. Christine Jane Bradshaw (a civilian nominated by the ILF), for descending on a winch in rough weather, having been to sea only once before in benign conditions, to assist in treating and rescuing the last surviving crew member of the tanker FR8 Venture, in the Pentland Firth, Scotland, in November 2006;
  • The crew of the ocean-going rescue tug Nanhaijiu III, of Nanhai Rescue Bureau (nominated by China), for a series of successful rescue missions since the rescue tug was put into service in March 2006, including the location and rescue of 14 small Vietnamese fishing boats during typhoon Chanchu, in May 2006;
  • Mr. Brett Churcher, skipper of the fishing boat Striker (nominated by ILF), for prompt and effective actions which led to the saving of the lives of a man and his four-year old daughter off Cape Palliser, New Zealand, in April 2007;
  • The crews of the fast action lifeboats and vessels of the Spanish Maritime Safety Agency (nominated by Spain), for a series of successful operations to locate and recover safely, thousands of migrants at sea. Between March 2006 and February 2007, 30,493 migrants were assisted by the Spanish rescue services in the Atlantic and the Mediterranean;
  • Viktors Timoscenko, Master of the Latvian-registered tanker Ance (nominated by IFSMA), for persisting in the successful rescue of two persons adrift on a catamaran, after other efforts had been called off, during an operation that lasted almost 14 hours at night time, some 834km off Cape Cod, United States, in November 2006; and
  • Station Officer Kekoi Jaiteh, of the West Gambia Fire Department (nominated by ILF), for actions which resulted in the saving of the captain and three crew members from a capsized cargo vessel in rough inshore waters, in January 2007.

The IMO Council endorsed the view of the judging panel that the 11 remaining individuals or services that had also been nominated for the 2007 Award should each receive a letter of commendation.

The IMO Award for Exceptional Bravery at Sea was established by the Organization to provide international recognition for those who, at the risk of losing their own life, perform acts of exceptional bravery, displaying outstanding courage in attempting to save life at sea or in attempting to prevent or mitigate damage to the marine environment.

Nominations for 21 acts of bravery were received for the 2007 Award, from nine Member States and three non-governmental organizations in consultative status. The nominations focused on such factors as location of the incident; prevailing weather conditions; skill displayed; leadership demonstrated; determination to conduct the rescue operation; exceptional courage demonstrated; and degree of risk (to human lives and/or the marine environment) involved.

The nominations were scrutinized initially by the Assessment Panel made up of members of non-governmental organizations* in consultative status with IMO, which met at IMO on 30 May 2007, under the chairmanship of the Secretary-General.

The Panel of Judges met at IMO Headquarters on 22 June 2007 (under the chairmanship of the Chairman of the IMO Council, and with the participation of the Acting Chairman of the Maritime Safety Committee and the Chairmen of the Marine Environment Protection Committee, the Legal Committee and the Facilitation Committee) to consider the recommendations of the Assessment Panel and to select the recipient of the Award.

* The International Shipping Federation Limited (ISF); the International Confederation of Free Trade Unions (ICFTU); the International Maritime Pilots' Association (IMPA); the International Federation of Shipmasters' Associations (IFSMA); the International Salvage Union (ISU); the International Lifeboat Federation (ILF); and the International Christian Maritime Association (ICMA).

RS


Friday, August 3, 2007

Dream cruise to Vanuatu turns to 'holiday from hell

5:00AM Friday July 13, 2007
By Eloise Gibson

Passengers on a Pacific Star (video courtesy of tallpappy74 ) cruise were so ill as the ship was battered by storms off Auckland that they have been given free doctors' visits and $100 vouchers.

About 1000 passengers left Auckland on Tuesday for an eight-night cruise and were hit by the atrocious conditions.

People on board reported passengers being sick and damage to the boat by swells of up to 10m.

One passenger said the dream trip to Vanuatu had started like the holiday from hell.

P&O Cruises spokeswoman Sandy Olsen said some of the ship's external windows and doors, as well as its television satellite equipment, were damaged in the storm.

"It would have been an uncomfortable couple of days for the people on board," she said.

"As you can imagine, some people were unwell due to seasickness."

Conditions were so bad the ship has cancelled a planned stopover in Lifou, New Caledonia, and will head straight for Vila to make its scheduled Friday night stopover.

Ms Olsen said passengers would get $100 spending money and P&O would waive doctors' charges for those who needed medical help during the storm.


Here is an oldie but goodie. How would you like to see this type of wave coming at you? This the German cargo ship MV Taifun back in 1976, location the English Channel, searching for survivors of a sinking Russian ship. Hold on to your shorts!


Lastly this is a video of the M/V Napoli being split in two...


UK – update on MSC NAPOLI

The Devon County Council issued a Situation Update regarding the MSC NAPOLI. The bow section is at anchor offshore. An emergency towing bridal has been rigged. The stern section remains aground and is stable. Small amounts of oil continue to emanate from the two sections. (7/27/07)... Holland and Knight LLP

Maritime Notes:

Coast Guard Day – 2007

Tomorrow, August 4, 2007, marks the 217th anniversary of the adoption by Congress of legislation to establish a “system of cutters” to protect the revenue of the young United States of America. As indicated in Coast Guard History, other missions were added over the years and other agencies were merged to form the modern United States Coast Guard. Semper Paratus! Thanks Dennis!

Weather Story:

Typhoon USAGI
Aug. 3 (Bloomberg) -- Typhoon Usagi swept across Kyushu, leaving at least 18 people hurt and bringing torrential rain to the southwestern Japanese island before weakening into a tropical storm. About 6,100 people were stranded by canceled flights.

Chicagoland weekend weather... HOT.. HUMID.. MUGGY, chance of T-Storms and great beach weather... Stay cool and have a great weekend!

RS

Thursday, August 2, 2007

Third in a Series; Subsea Atmospheres - Waves

Waves in the environment
By
Dr J Floor Anthoni

Without waves, the world would be a different place. Waves cannot exist by themselves for they are caused by winds. Winds in turn are caused by differences in temperature on the planet, mainly between the hot tropics and the cold poles but also due to temperature fluctuations of continents relative to the sea.
Without waves, the winds would have only a very small grip on the water and would not be able to move it as much. The waves allow the wind to transfer its energy to the water's surface and to make it move. At the surface, waves promote the exchange of gases: carbon dioxide into the oceans and oxygen out. Currents and eddies mix the layers of water which would otherwise become stagnant and less conducive to life. Nutrients are thus circulated and re-used. The large ocean currents transport warm water from the tropics to the poles and cold water the other way. They help to stabilise the planet's temperature and to minimise its extremes. For instance, because of warm ocean currents arriving from the north, the temperature of New Zealand is 3-4 degrees higher than it would be without them.

For the creatures in the sea, ocean currents allow their larvae to be dispersed and to be carried great distances. Many creatures spawn only during storms when large waves can mix their gametes effectively.

Coastal creatures living in shallow water experience the brunt of the waves directly. In order to survive there, they need to be robust and adaptable. Thus waves maintain a gradient of biodiversity all the way from the surface, down to depths of 30m or more. Without waves, there would not be as many species living in the sea.

Waves pound rocks and make them erode faster, but sea organisms covering these rocks, delay this process. Waves make beaches by transporting sand from deeper down towards the shore and by washing the sand and removing fine particles. Waves stir and suspend the sand so that currents or gravity can transport it.

Wave motion
Anyone having watched water waves rippling outward from the point where a stone was thrown in, should have noticed how effortlessly waves can propagate along the water's surface. Wherever we see water, we see its surface stirred by waves. Indeed, witnessing a lake or sea flat like a mirror, is rather unusual. Yet, as familiar we are with waves, we are unfamiliar with how water particles can join forces to make such waves.

Waves are oscillations in the water's surface. For oscillations to exist and to propagate, like the vibrating of a guitar string or the standing waves in a flute, there must be a returning force that brings equilibrium. The tension in a string and the pressure of the air are such forces. Without these, neither the string nor the flute could produce tones. The standing waves in musical instruments bounce their energy back and forth inside the string or the flute's cavity. The oscillations that are passed to the air are different in that they travel in widening spheres outward. These travelling waves have a direction and speed in addition to their tone or timbre. In air their returning force is the compression of the air molecules. In surface waves, the returning force is gravity, the pull of the Earth. Hence the name 'gravity waves' for water waves.

In solids, the molecules are tightly connected together, which prevents them from moving freely, but they can vibrate. Water is a liquid and its molecules are allowed to move freely although they are placed closely together. In gases, the molecules are surrounded by vast expanses of vacuum space, which allows them to move freely and at high speed. In all these media, waves are propagated by compression of the medium. However, the surface waves between two media (water and air), behave very different and solely under the influence of gravity, which is much weaker than that of elastic compression, the method by which sound propagates.

The specific volume of sea water changes by only about 4 thousands of 1 percent (4E-5) under a pressure change of one atmosphere (1 kg/cm2). This may seem insignificant, but the Pacific Ocean would stand about 50m higher, except for compression of the water by virtue of its own weight, or about 22cm higher in the absence of the atmosphere. Since an atmosphere is about equal to a column of water 10m high, the force of gravity is about 43 times weaker than that of elastic compression.
Surface tension (which forms droplets) exerts a stress parallel to the surface, equivalent to only one 74 millionth (1.4E-8) of an atmosphere. Its restoring force depends on the curvature of the surface and is still smaller. Nevertheless it dominates the behaviour of small ripples (capillary waves), whose presence greatly contributes to the roughness (aerodynamic drag) of the sea surface, and hence, to the efficiency with which can generate larger waves and currents. (Van Dorn, 1974)

If each water particle makes small oscillations around its spot, relative to its neighbours, waves can form if all water particles move at the same time and in directions that add up to the wave's shape and direction. Because water has a vast number of molecules, the height of waves is theoretically unlimited. In practice, surface waves can be sustained as high as 70% of the water's depth or some 3000m in a 4000m deep sea (Van Dorn, 1974).
Note that the water particles do not travel but only their collective energy does! Waves that travel far and fast, undulate slowly, requiring the water particles to make slow oscillations, which reduces friction and loss of energy.

Wave motionIn the diagram some familiar terms are shown. A floating object is observed to move in perfect circles when waves oscillate harmoniously sinus-like in deep water. If that object hovered in the water, like a water particle, it would be moving along diminishing circles, when placed deeper in the water. At a certain depth, the object would stand still. This is the wave's base, precisely half the wave's length. Thus long waves (ocean swell) extend much deeper down than short waves (chop). Waves with 100 metres between crests are common and could just stir the bottom down to a depth of 50m. Note that the depth of a wave has little to do with its height! But a wave's height contains the wave's energy, which is unrelated to the wave's length. Long surface waves travel faster and further than short ones. Note also that the forward movement of the water under a crest in shallow water is faster than the backward movement under its trough. By this difference, sand is swept forward towards the beach.

Water waves can store or dissipate much energy. Like other waves (alternating electric currents, e.g.), a wave's energy is proportional to the square of its height (potential). Thus a 3m high wave has 3x3=9 times more energy than a 1m high wave. When fine-weather waves of about 1m height pound on the beach, they dissipate an average of 10kW (ten one-bar heaters) per metre of beach or the power of a small car at full throttle, every five metres. (Ref Douglas L Inman in Oceanography, the last frontier, 1974). Attempts to harness the energy from waves have failed because they require large structures over large areas and these structures should be capable of surviving storm conditions with energies hundreds of times larger than they were designed to capture.

Waves have a direction and speed. Sound waves propagate by compressing the medium. They can travel in water about 4.5 times faster than in air, about 1500m per second (5400km/s, or mach-4.5, depending on temperature and salinity). Such waves can travel in all directions and reach the bottom of the ocean (about 4km) in less than a second. Surface waves, however, are limited by the density of water and the pull of gravity. They can travel only along the surface and their wave lengths can at most be about twice the average depth of the ocean (2 x 4 km). The fastest surface waves observed, are those caused by tsunamis. The 'tidal wave' caused by an under-sea earthquake in Chile in May 1960, covered the 6000 nautical miles (11,000km) to New Zealand in about 12 hours, travelling at a speed of about 900 km/hr! When it arrived, it caused an oscillation in water level of 0.6m at various places along the coast, 1.4m in Tauranga Harbour and 2.4m in Whitianga harbour. Note that tsunamis reach their minimum at about 6000 km distance. Beyond that, the curvature of the Earth bends the wave fronts to focus them again at a distance of about 12,000 km, where they can still cause considerable damage.

The relationship between wave speed (phase velocity) and depth of long surface waves in shallow water is given by the formula
c x c = g x d x (p2 - p1) / p2 or
c x c= g x d for water/air
where c= wave speed, g= acceleration of gravity (9.8066 m/s/s), d= wave depth (or upper layer depth, m), p2= density of water (=1) and p1= density of air (= 0.00125).
The formula states that wave speed increases with wave depth and the relative difference in density.
For an ocean depth of 4000m, a wave's celerity or speed would be about SQR(10 x 4000) = 200 m/s = 720 km/hr. Surface waves could theoretically travel much faster on larger planets, in media denser than water.


For deep water, the relationship between speed and wavelength is given by the formula:
l = g x t x t / (2 x pi)
l = t x c for all kinds of waves, substitute in above equation: t x c = g x t x t / (2 x pi)
c = g x t / (2 x pi) or t = c x 2 x pi / g or t = c x 0.641 (s)
where t= wave period (sec), f= wave frequency, l= wave length (m) and pi=3.1415...
to calculate c and l from wave period t (in sec): c = t x 1.56 m/s= t x 5.62 km/hr = t x 3.0 knot
l = 1.56 x t x t (metres)
Thus waves with a period of 10 seconds, travel at 56 km/hr with a wave length of about 156m. A 60 knot (110 km/hr) gale can produce in 24 hours waves with periods of 17 seconds and wave lengths of 450m. Such waves travel close to the wind's speed (97 km/hr). A tsunami travelling at 200 m/s has a wave period of 128 s, and a wave length of 25,600 m.
Wave speed, period and length with depthThese two diagrams show the relationships between wave speed and period for various depths (left), and wave length and period (right), for periodic, progressive surface waves. (Adapted from Van Dorn, 1974) Note that the term phase velocity is more precise than wave speed.

The period of waves is easy to measure using a stopwatch, whereas wave length and speed are not. In the left picture, the red line gives the linear relationship between wave speed and wave period. A 12 second swell in deep water travels at about 20m/s or 72 km/hr. From the red line in the right diagram, we can see that such swell has a wave length between crests of about 250m.
When the 12s swell enters 10m shallow water (follow the green curve for 10m), its speed will halve to 10m/s (left graph) and so will its wave length (right graph). But the height of the wave increases by a similar factor (not shown here).

The rougher the water becomes, the easier it is for the wind to transfer its energy. The waves become steep and choppy. Further away from the shore, the water's surface is not only stirred by the wind but also by waves arriving with the wind. These waves influence the motion of the water particles such that opposing movements gradually cancel out, whereas synchronising movements are enhanced. The waves start to become more rounded and harmonious. Depending on duration and distance (fetch), the waves develop into a fully developed sea.

Anyone familiar with the sea, knows that waves never assume a uniform, harmonious shape. Even when the wind has blown strictly from one direction only, the resulting water movement is made up of various waves, each with a different speed and height. Although some waves are small, most waves have a certain height and sometimes a wave occurs which is much higher.

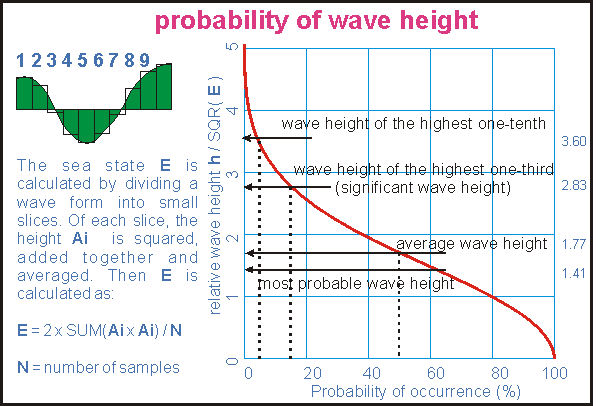
Wave height probabilityWhen trying to be more precise about waves, difficulties arise: how do we measure waves objectively? When is a wave a wave and should be counted? Scientists do this by introducing a value E which is derived from the energy component of the compound wave. In the left part of the drawing is shown how the value E is derived entirely mathematically from the shape of the wave. Instruments can also measure it precisely and objectively. The wave height is now proportional to the square root of E.
The sea state E is two times the average of the sum of the squared amplitudes of all wave samples.
The right part of the diagram illustrates the probability of waves exceeding a certain height. The vertical axis gives height relative to the square root of the average energy state of the sea: h / SQR( E ) . For understanding the graph, one can take the average wave height at 50% probability as reference.

Fifty percent of all waves exceed the average wave height, and an equal number are smaller. The highest one-tenth of all waves are twice as high as the average wave height (and four times more powerful). Towards the left, the probability curve keeps rising off the scale: one in 5000 waves is three times higher and so on. The significant wave height H3 is twice the most probable height and occurs about 15% or once in seven waves, hence the saying "Every seventh wave is highest". Click here for a larger version of this diagram.

Energy spectra for fully developed seasWhen the wind blows sufficiently long from the same direction, the waves it creates, reach maximum size, speed and period beyond a certain distance (fetch) from the shore. This is called a fully developed sea. Because the waves travel at speeds close to that of the wind, the wind is no longer able to transfer energy to them and the sea state has reached its maximum. In the picture the wave spectra of three different fully developed seas are shown. The bell curve for a 20 knot wind (green) is flat and low and has many high frequency components (wave periods 1-10 seconds). As the wind speed increases, the wave spectrum grows rapidly while also expanding to the low frequencies (to the right). Note how the bell curve rapidly cuts off for long wave periods, to the right. Compare the size of the red bell, produced by 40 knot winds, with that of the green bell, produced by winds of half that speed. The energy in the red bell is 16 times larger!
Important to remember is that the energy of the sea (maximum sea condition) increases very rapidly with wind speed, proportional to its fourth power. The amplitude of the waves increases to the third power of wind speed. This property makes storms so unexpectedly destructive.

The biggest waves on the planet are found where strong winds consistently blow in a constant direction. Such a place is found south of the Indian Ocean, at latitudes of -40º to -60º, as shown by the yellow and red colours on this satellite map. Waves here average 7m, with the occasional waves twice that height! Directly south of New Zealand, wave heights exceeding 5m are also normal. The lowest waves occur where wind speeds are lowest, around the equator, particularly where the wind's fetch is limited by islands, indicated by the pink colour on this map. However, in these places, the sea water warms up, causing the birth of tropical cyclones, typhoons or hurricanes, which may send large waves in all directions, particularly in the direction they are travelling.

For the complete series visit: Seafriends.org

Weather Story;

Typhoon Usagi is tracking closer to Japan and expect to hit the island today. To top that one, a small tsunami hit the Japanese Island of Hokkaido, no damage was reported. Tropical Storm Eric is still spinning in he eastern pacific and TS Chantel is off the NHC radar.


RS