Showing posts with label wind. Show all posts

Thursday, July 10, 2008

New Wind Measurement Technology May Help Olympic Sailing, Aviation and Weather Forecasting

New Wind Measurement Technology May Help Olympic Sailing, Aviation and Weather Forecasting

ScienceDaily (July 3, 2008)
A team of researchers at the Ocean University of China has developed and tested a mobile lidar (light detection and ranging) station that can accurately measure wind speed and direction over large areas in real time -- an application useful for aviation safety, weather forecasting and sports.

The mobile lidar station can measure wind fields more accurately, which could help world-class athletes compete in international competitions, such as the Olympics. Ocean University is in Qingdao, which is hosting the sailing competitions of the XXIX Olympic Games and the Beijing 2008 Paralympic Games, and this technique is being tested in conjunction with the event.

"Wind is non-uniform even in a small sailing field," says Professor Zhi-Shen Liu of the Key Laboratory of Ocean Remote Sensing, Ministry of Education of China, Ocean University of China, who led the research. "Athletes could maximize their performances if they have the most accurate information to help them capture the wind."

In Olympic sailing, individual competitors or teams of athletes sail various classes of sailboats in timed trials over a single course. The contest requires them to navigate upwind, downwind and everything in between. Their final time depends on numerous factors, including the boat design, the skill of the sailors, course difficulty and ocean currents. Perhaps the most important factor, though, is how well the athletes can harness the wind that fills their sails.

Because wind constantly changes speed and direction, athletes and coaches hope to have the best information at the start of a run. On cloudy, rainy days, the standard meteorological tool of Doppler radar can accurately provide wind field information. When no clouds are present, however, Doppler radar is ineffective. The best wind data on clear days comes from ocean buoys and land stations that use wind cups and ultrasonic anemometers to measure wind speed.

In the Qingdao sailing area, where this summer's competitions will take place, only four buoys, one boat and one tower are available to measure sea surface winds within a competition area of approximately 10 square kilometers.

Liu and his lidar group, composed of research scientists and graduate students, have been working with an optical remote sensing technology called Doppler lidar, which they are applying for weather and environmental research. Lidar works by scattering laser beams off atmospheric aerosols or molecules. Doppler lidar takes advantage of the fact that when these aerosols or molecules are moving in the wind, the scattered laser light changes frequency -- the same way an approaching car has a higher pitched sound than a car driving away.

The advantage of Doppler lidar, says Liu, is that it can quickly sample a large area, providing a much finer map of winds than buoys alone. He and his group have developed a lidar bus, which can move equipment to the experiment field conveniently.

Last year, they successfully tested their new bus at the 2007 Qingdao International Regatta sailing event. They moved the bus to the seashore near the sailing field, and made a horizontal scan over the sea surface, making the measurement in real time and then uploading the data to the local meteorological station every 10 minutes. They envision a similar effort in the upcoming Olympic and Paralympic games.

The research was funded by the National Natural Science Foundation of China, the Key Laboratory of Ocean Remote Sensing, the Ministry of Education of China and the China Meteorological Administration (CMA).

WEATHER NOTE

U.S. Department of Labor Giving $17 Million to Iowa to Aid Recovery From Flooding and Tornadoes

WASHINGTON, June 18 /PRNewswire-USNewswire/ -- The U.S. Department of Labor today announced a $17,127,000 grant to create approximately 600 temporary jobs for eligible dislocated workers in Iowa to assist in the cleanup and recovery resulting from damage caused by recent flooding and tornadoes.

"Our hearts go out to Iowans who are suffering from the ongoing flooding and who were victims of the recent tornadoes, including last week's tragic loss of life at a Boy Scout camp," said Secretary of Labor Elaine L. Chao. "This $17 million grant will pay for temporary jobs to aid in the cleanup and recovery from these natural disasters and will provide humanitarian assistance to Iowans in need."

The Federal Emergency Management Agency has declared multiple counties across Iowa as eligible for its Public Assistance Program.

The grant, awarded to the Iowa Workforce Development agency, will provide funding to create temporary jobs to assist in cleanup, demolition, repair, renovation and reconstruction of destroyed public structures, facilities and lands within the affected communities. Funds will also be used for projects that provide food, clothing, shelter, and other types of humanitarian assistance for disaster victims, including work on the homes of individuals who are eligible for the federally funded weatherization program.

Of the total announced today, $6,000,000 will be released initially, with the balance expected to be released on or around June 30.

National Emergency Grants are part of the secretary of labor's discretionary fund and are awarded based on a state's ability to meet specific guidelines. For more information on National Emergency Grants, visit www.doleta.gov/NEG.

U.S. Department of Labor releases are accessible on the Internet at www.dol.gov. The information in this news release will be made available in alternate format (large print, Braille, audio tape or disc) from the COAST office upon request. Please specify which news release when placing your request at 202-693-7828 or TTY 202-693-7755. The Labor Department is committed to providing America's employers and employees with easy access to understandable information on how to comply with its laws and regulations. For more information, please visit www.dol.gov/compliance.

Source: U.S. Department of Labor

Volunteer Agencies Play Key Role In Wisconsin Disaster Recovery

Release Date: June 28, 2008
Release Number: 1768-036

» More Information on Wisconsin Severe Storms, Tornadoes, and Flooding

MADISON, Wis. -- Wisconsin residents who suffered losses from the recent severe storms, tornadoes and flooding and continue to have unmet needs may seek help through a number of volunteer groups.

"We would like to encourage Wisconsin residents to take advantage of our 2-1-1 Program when looking for additional assistance," said Wisconsin Emergency Management (WEM) Administrator Johnnie Smith. "It's a valuable resource that unites those who want to help with those who most need assistance."

Residents can dial 2-1-1 on their telephones to obtain information on local volunteer agencies working in their county. The 2-1-1 operators have phone numbers, program and services information, locations, hours of operation and other relevant resources. Those who call 2-1-1 may be referred to resources including housing assistance, counseling services, employment opportunities and health services.

"The volunteer groups are vital elements in all state and federal recovery efforts as they focus on helping families develop effective recovery plans," said Federal Coordinating Officer Dolph Diemont of the Federal Emergency Management Agency (FEMA). As federal coordinating officer, Diemont directs the federal side of the federal/state disaster response and recovery efforts in Wisconsin.

Anyone affected by the recent storms and flooding should register with FEMA by calling 1-800-621-FEMA (3362) or TTY 1-800-462-7585. Wisconsin residents can also register online at www.fema.gov/.

For individuals seeking more information and/or possible participation, here are two volunteer groups currently working in Wisconsin:

Salvation Army
1-800-264-6412 / www.salvationarmywi.org

American Red Cross
1-866-GET-INFO (1-866-438-4636) / www.redcross.org

FEMA coordinates the federal government's role in preparing for, preventing, mitigating the effects of, responding to, and recovering from all domestic disasters, whether natural or man-made, including acts of terror.

MARITIME NOTE

HOT FROM gCAPTAIN.....

This is a problem for all blue water mariners. My contacts tell me that this downgrade is due to special interest such as "private weather services" who want NOAA out of the business of supplying public "open source" weather data. It looks like someone is lobbying someone on the Hill or at NOAA for these changes...

All mariners need to take notice and write david.feit@noaa.gov and let him know that we need this "public service" unchanged!


NOAA To Make Surface Chart Cutback

July 8th, 2008


<span class=NOAA Surface Chart Notice" height="320" width="501">

The above shows a notice box on NOAA’s current 24hr Surface Prediction Chart which can be found HERE. It states:

On 08/15/08 the limits of this chart will change to 24N-48N, 48W-101W. Send comments to David.Feit@noaa.gov by 07/15/08

Notice on the live version of this chart Hurricane Bertha and the area of low pressure to her Northeast are both outside the proposed limits! Here at gCaptain we consider this a degradation of service not a simple adjustment of scale and are supprised by this move from an otherwise rational government organization. It is our opinion that the boundries of this chart should instead be increased to cover the entire North Atlantic which would bring it inline with NOAA’s 48 and 96 hour prediction charts (view all charts HERE)!

Please leave your comments regarding this change bleow and we will be sure they get fowarded on to Mr. Feit and our contacts at NOAA. READ>

USCG Safety Alert: Controllable Pitch Propeller Systems and Situational Awareness

Coast Guard strongly recommends that owners, operators, and masters of vessels with controllable pitch propellers understand the design and operation of the system after marine casualty in March of 2008 involving a fishing vessel in the Bering Sea resulted in multiple fatalities and complete loss of the vessel.

July 2, 2008 (Washington, DC): A marine casualty in March of 2008 involving a fishing vessel in the Bering Sea resulted in multiple fatalities and complete loss of the vessel. A Marine Board of Investigation is currently examining the various circumstances surrounding the casualty. Although the investigation is not complete, safety issues associated with casualty have been identified that merit immediate public dissemination.

Based on the survivors' testimony, the crew experienced difficulty with launching and entering the three liferafts because the vessel was making considerable sternway when the order to abandon ship was issued. Evidence indicates the main engines were still running and the vessel was backing with significant astern pitch. Consequently, two of the liferafts quickly traveled forward past the bow of the vessel when they were launched. Attempts to retrieve the liferafts using the painter lines were unsuccessful. As a result, the majority of the crew members were forced to jump into the 34°F water and attempt to swim to the liferafts. Ultimately, only 22 members of the vessel's crew made it into the liferafts. All of these crew members survived. Of the other 25 crew members who never made it into a liferaft, four died and one remains missing.

The Coast Guard strongly recommends that owners, operators, and masters of vessels with controllable pitch propellers understand the design and operation of the system. This includes the primary and emergency sources of power for both the control and main systems, the location and procedures for using alternate control stations, and the locations of the emergency shutdowns. While controllable pitch propeller systems are generally designed and constructed to fail in the "as is" position, in hydraulic CPP systems, the actual blade pitch may change. In this case the vessel was making considerable sternway. This was not a unique occurrence. The MS EXPLORER also experienced this problem before it sank in November of 2007. Vessel operators, masters and crew members must be prepared to respond accordingly.

In light of this incident, vessel owners, operators, masters and crew members should also be mindful of the following safety issues:

1. Vessel masters and officers must maintain situational awareness at all times and understand the effects of their actions and decisions on the safety of their crew, especially during emergency situations involving flooding. This includes understanding what impact the vessel's speed, heading, heel, and trim will have on the crew as it abandons ship.

2. The master or individual in charge must evaluate the particular circumstances of each emergency situation (weather, seas, experience of crew, condition of vessel, etc.) and adjust emergency procedures accordingly to provide for the safety of his crew, vessel, and the environment.

3. All crew members should understand that immersion suits will affect their dexterity, limit mobility, and may make it more difficult to launch survival craft, particularly when the survival craft are covered with snow or ice. Crew members responsible for launching the survival craft should practice and be able to do so with their immersion suits on. Lifesaving gear should be kept free of ice and snow whenever possible.

4. When abandoning ship, crewmembers should make every effort to enter directly into a liferaft or lifeboat before entering the water. If crewmembers must enter the water, they should stay together and attempt to enter a liferaft, climb onto floating debris, or use any other means available to get themselves out of the water as soon as possible.

5. Emergency Drills should not be limited to routine procedures such as donning immersion suits. Emergency drills should ensure all crew members, including bridge and engine room personnel, understand and practice what to do in various emergency situations under actual conditions.


Additional information regarding emergency procedures for Commercial Fishing Vessels can be found at: http://www.fishsafe.info.

This safety alert is provided for informational purpose only and does not relieve any domestic or international safety, operational or material requirement. Developed and distributed by the Office of Investigations and Analysis, United States Coast Guard Headquarters, Washington, DC.


RS

Monday, May 5, 2008

Wind Patterns Could Mask Effects Of Global Warming In Ocean

Wind Patterns Could Mask Effects Of Global Warming In Ocean

ScienceDaily (Feb. 15, 2008) — Scientists at the University of Liverpool have found that natural variability in the earth's atmosphere could be masking the overall effect of global warming in the North Atlantic Ocean.

Scientists have previously found that surface temperatures around the globe have risen over the last 30 years in accord with global warming. New data, however, shows that heat stored in the North Atlantic Ocean has a more complex pattern than initially expected, suggesting that natural changes in the atmosphere also play a role.

The Liverpool team, in collaboration with the University of Duke in the US, analysed 50 years of North Atlantic temperature records and used computer models to assess how the warming and cooling pattern was controlled. They found that the tropics and mid-latitudes have warmed, while the sub-polar regions have cooled.

Professor Ric Williams, from the University's School of Earth and Ocean Sciences, explains: "We found that changes in the heat stored in the North Atlantic corresponded to changes in natural and cyclical winds above the North Atlantic. This pattern of wind movement is called the North Atlantic Oscillation (NAO), which is linked to pressure differences in the atmosphere between Iceland and The Azores.

"The computer model we used to analyse our data helped us to predict how wind and heat exchange with the atmosphere affects the North Atlantic Ocean's heat content over time. We found that the warming over the mid latitudes was due to the wind redistributing heat, while the gain in heat in the tropics and loss in heat at high latitudes was due to an exchange of heat with the atmosphere.

"These local changes in heat storage are typically 10 times larger than any global warming trend. We now need to look at why changes are occurring in wind circulation, as this in itself could be linked to global warming effects."

Although natural variability appears to be masking global warming effects in the ocean, scientists still believe that global warming is occurring, as evident through a wide range of independent signals such as rising surface and atmospheric temperatures, reduced Arctic summer sea ice and the reduced extent of many glaciers showing changes in the environment.

The research is published in Science. This study was jointly supported by the UK Natural Environment Research Council (NERC) and the US National Science Foundation.

Adapted from materials provided by University of Liverpool, via EurekAlert!, a service of AAAS.

Total Lightning...What is it and why is it significant?

For years, information about Cloud to Ground lightning (CGs) has been available from the National Lightning Detection Network (NLDN). The NLDN network, along with the long range lightning detection network which detect CGs over a portion of the oceaninc regions is maintained by Vaisala. Other smaller companies also maintain lightning networks across the continental United States, and other parts of the globe.

However, we know from various field experiments (and human observations) that Cloud to Ground lightning strikes represent only a small portion of the complete electrical signal within a thunderstorms. In fact, cloud flashes comprise the largest percentage of the lightning spectrum in all storms.

Researches from NASA, academia, and the private sector have often longed for better methods to detect and track these cloud flashes. One such method is to develop a ground based lightning mapper which detects radiation sources emitted within the lightning channel. Networks such as these have been installed at several locations across the country by researchers at New Mexico Tech and Vaisala.

Specifically, the North Alabama Lightning Mapping Array (developed by New Mexico Tech) has been operational across the Tennessee Valley since early 2003 and provides forecasters with real-time total lightning information for forecast and warning operations. This information has proved critical in assessing the storm scale characteristics of developing thunderstorms including updraft trends and echo top growth. The ability to correlate these trends with the onset of severe weather has also proved vital to the warning and decision making process. The downside to these ground based networks are the limited range of detectability and the expenses involved in expanding an existing network or installing a new network.

With the launch of the next generation of GOES satellites beginning with GOES-R around 2014, the Geostationary Lightning Mapper (GLM) will provide total lightning information for a large area extending from New Zealand to the west coast of Africa. This will cover a large oceanic region where we now have limited information concerning convective procesess, and also provided greater detail over the severe weather rich region of the continental United States. In addition to the GLM, the GOES-R satellite (and beyond) will contain the Advanced Baseline Imager which will provide high resolution imagery (up to 500 meters in the visible spectrum) at 16 different channels. The temporal resolution will be as great as 30 seconds when the satellite is operation in mesoscale sector format.

For more information on total lightning applications or other collaborative activities ongoing between NASA, UAH, and WFO Huntsville see http://weather.msfc.nasa.gov/sport/

You can select the "Meetings" link for a view of various conferences and individual presentations.

WEATHER NOTE

Storms bring heavy downpours, 59 m.p.h. gusts

By Tom Skilling

May 3, 2008

Gusty thunderstorms raked the Chicago area in waves Friday, peppering some locations with pea-size hail while unleashing downpours so heavy in other areas that motorists were forced to the side of the road.

The 1.28 inches measured at O'Hare International Airport broke the record of 1.26 inches set in 1979 and included 0.43 inches that fell in just 7 minutes. An evening cloudburst that hit west suburban Elgin just before 7 p.m. swamped that city with 1.5 inches in only 15 minutes. Other heavy rain totals included 1.32 inches in Glenview, 1.2 inches in Lombard and 1.14 inches in Northbrook.

Powerful south winds topped 40 m.p.h. in and out of Friday's thunderstorms, and evening storm gusts were estimated at 50 m.p.h. in sections of Rockford while Weather Bug wind sensors clocked gusts of 59 m.p.h. at Marshall High School in Chicago and 56 m.p.h. gusts at Lansing Municipal Airport in southern Cook County. Storm winds toppled a 2-foot diameter tree in Kankakee.

MAYDAY STORMS 2008


From Stormer Chasers - Tony Perkins, Chris White and David Drufke

May 1st, 2008: Siouxland, IA/SD

Video of some crazy storm motions. About at the 45 second mark is the motion-iest:

Video Link (Xvid AVI)


Alternative formats: WMV

CONFERENCE IV -WASHINGTON DC

Welcome to the Eastern U.S. Weather conference website. For 2008, we have selected the Hyatt Regency Crystal City at Reagan National Airport as the location for our annual conference. You do not have to be a member of EasternUSwx.com to attend.The conference is open to all who have a passion for weather and want to learn more about the subject.

Highlights this year include: Three to Four workshops the day before the conference presentations and a Friday night get together/reception where you will have a chance to meet folks who share similar enthusiasm for a variety of weather-related topics, mingle and browse various weather exhibitions. Please take a moment, read through the site and be sure to register for what promises to be an unforgettable weekend.

MARITIME NOTE

New role for Riverdance ferry

German band Fotos in front of The Riverdance

IT has featured in countless newspapers, been shown on TV news around the world, attracted thousands of hits on YouTube and now the stricken ferry Riverdance has become the star of a pop video.

Blackpool's latest and most unusual tourist attraction has been picked as the location for the filming of a video by up-and-coming German band Fotos to accompany their single Explosion.

t was chosen as a set by director Uwe Flade, who had seen the wreck on various websites, and filming took place on the beach at Cleveleys yesterday.

Matt Cummins, producer from London-based production company Draw Pictures, said: " The director thought Riverdance would make a good, interesting backdrop.

"The band loved it, so we made some calls to the Blackpool tourist board and they were really helpful."

Mike Chadwick, from Blackpool Tourism, said: "Blackpool has been the setting for several pop videos over the years, including Simply Red and Robbie Williams.

"It just shows as well how famous Riverdance has become – making it into the world of pop."

A spokesman for the Maritime and Coastguard Agency said there was no progress on cutting up Riverdance –which was due to start this week.


RS

Tuesday, September 4, 2007

A CAT 5 "Felix" Makes Landfall

Hurricane Felix has made landfall in Northeast Nicaragua, northeast of Puerto Cabezas. Felix is now a Cat 5 storm.

Felix's current storm position as of
Sep 4 - 12:00 UTC is Latitude: 14.3
Longitude: -83.2 with maximum winds of 160 mph and a pressure of 935 mb.

During the morning hours Felix gained Category 5 strength from the warm Caribbean waters. This is a very powerful and dangerous storm.

Up to 40,000 Hondurans were evacuated to shelters but some 15,000 people were unable to find transportation and were forced to ride out the storm in their homes.
Its too early to report on any damage but we will be updating through out the day, so stay tuned.....


In the Pacific....

TS Henriette is now Hurrciane Henriette a Category 1 Hurricane with its outer bands approaching the southern tip of Baja California....

Henriette forecast storm position as of Sep 4 - 09:00 UTC was
Latitude: 21.4/ Longitude: -109.1
Maximum winds of 75 mph.


latest goes west infra red hurricane image


We will keep you posted!
RS

Friday, August 3, 2007

Dream cruise to Vanuatu turns to 'holiday from hell

5:00AM Friday July 13, 2007
By Eloise Gibson

Passengers on a Pacific Star (video courtesy of tallpappy74 ) cruise were so ill as the ship was battered by storms off Auckland that they have been given free doctors' visits and $100 vouchers.

About 1000 passengers left Auckland on Tuesday for an eight-night cruise and were hit by the atrocious conditions.

People on board reported passengers being sick and damage to the boat by swells of up to 10m.

One passenger said the dream trip to Vanuatu had started like the holiday from hell.

P&O Cruises spokeswoman Sandy Olsen said some of the ship's external windows and doors, as well as its television satellite equipment, were damaged in the storm.

"It would have been an uncomfortable couple of days for the people on board," she said.

"As you can imagine, some people were unwell due to seasickness."

Conditions were so bad the ship has cancelled a planned stopover in Lifou, New Caledonia, and will head straight for Vila to make its scheduled Friday night stopover.

Ms Olsen said passengers would get $100 spending money and P&O would waive doctors' charges for those who needed medical help during the storm.


Here is an oldie but goodie. How would you like to see this type of wave coming at you? This the German cargo ship MV Taifun back in 1976, location the English Channel, searching for survivors of a sinking Russian ship. Hold on to your shorts!


Lastly this is a video of the M/V Napoli being split in two...


UK – update on MSC NAPOLI

The Devon County Council issued a Situation Update regarding the MSC NAPOLI. The bow section is at anchor offshore. An emergency towing bridal has been rigged. The stern section remains aground and is stable. Small amounts of oil continue to emanate from the two sections. (7/27/07)... Holland and Knight LLP

Maritime Notes:

Coast Guard Day – 2007

Tomorrow, August 4, 2007, marks the 217th anniversary of the adoption by Congress of legislation to establish a “system of cutters” to protect the revenue of the young United States of America. As indicated in Coast Guard History, other missions were added over the years and other agencies were merged to form the modern United States Coast Guard. Semper Paratus! Thanks Dennis!

Weather Story:

Typhoon USAGI
Aug. 3 (Bloomberg) -- Typhoon Usagi swept across Kyushu, leaving at least 18 people hurt and bringing torrential rain to the southwestern Japanese island before weakening into a tropical storm. About 6,100 people were stranded by canceled flights.

Chicagoland weekend weather... HOT.. HUMID.. MUGGY, chance of T-Storms and great beach weather... Stay cool and have a great weekend!

RS

Thursday, August 2, 2007

Third in a Series; Subsea Atmospheres - Waves

Waves in the environment
By
Dr J Floor Anthoni

Without waves, the world would be a different place. Waves cannot exist by themselves for they are caused by winds. Winds in turn are caused by differences in temperature on the planet, mainly between the hot tropics and the cold poles but also due to temperature fluctuations of continents relative to the sea.
Without waves, the winds would have only a very small grip on the water and would not be able to move it as much. The waves allow the wind to transfer its energy to the water's surface and to make it move. At the surface, waves promote the exchange of gases: carbon dioxide into the oceans and oxygen out. Currents and eddies mix the layers of water which would otherwise become stagnant and less conducive to life. Nutrients are thus circulated and re-used. The large ocean currents transport warm water from the tropics to the poles and cold water the other way. They help to stabilise the planet's temperature and to minimise its extremes. For instance, because of warm ocean currents arriving from the north, the temperature of New Zealand is 3-4 degrees higher than it would be without them.

For the creatures in the sea, ocean currents allow their larvae to be dispersed and to be carried great distances. Many creatures spawn only during storms when large waves can mix their gametes effectively.

Coastal creatures living in shallow water experience the brunt of the waves directly. In order to survive there, they need to be robust and adaptable. Thus waves maintain a gradient of biodiversity all the way from the surface, down to depths of 30m or more. Without waves, there would not be as many species living in the sea.

Waves pound rocks and make them erode faster, but sea organisms covering these rocks, delay this process. Waves make beaches by transporting sand from deeper down towards the shore and by washing the sand and removing fine particles. Waves stir and suspend the sand so that currents or gravity can transport it.

Wave motion
Anyone having watched water waves rippling outward from the point where a stone was thrown in, should have noticed how effortlessly waves can propagate along the water's surface. Wherever we see water, we see its surface stirred by waves. Indeed, witnessing a lake or sea flat like a mirror, is rather unusual. Yet, as familiar we are with waves, we are unfamiliar with how water particles can join forces to make such waves.

Waves are oscillations in the water's surface. For oscillations to exist and to propagate, like the vibrating of a guitar string or the standing waves in a flute, there must be a returning force that brings equilibrium. The tension in a string and the pressure of the air are such forces. Without these, neither the string nor the flute could produce tones. The standing waves in musical instruments bounce their energy back and forth inside the string or the flute's cavity. The oscillations that are passed to the air are different in that they travel in widening spheres outward. These travelling waves have a direction and speed in addition to their tone or timbre. In air their returning force is the compression of the air molecules. In surface waves, the returning force is gravity, the pull of the Earth. Hence the name 'gravity waves' for water waves.

In solids, the molecules are tightly connected together, which prevents them from moving freely, but they can vibrate. Water is a liquid and its molecules are allowed to move freely although they are placed closely together. In gases, the molecules are surrounded by vast expanses of vacuum space, which allows them to move freely and at high speed. In all these media, waves are propagated by compression of the medium. However, the surface waves between two media (water and air), behave very different and solely under the influence of gravity, which is much weaker than that of elastic compression, the method by which sound propagates.

The specific volume of sea water changes by only about 4 thousands of 1 percent (4E-5) under a pressure change of one atmosphere (1 kg/cm2). This may seem insignificant, but the Pacific Ocean would stand about 50m higher, except for compression of the water by virtue of its own weight, or about 22cm higher in the absence of the atmosphere. Since an atmosphere is about equal to a column of water 10m high, the force of gravity is about 43 times weaker than that of elastic compression.
Surface tension (which forms droplets) exerts a stress parallel to the surface, equivalent to only one 74 millionth (1.4E-8) of an atmosphere. Its restoring force depends on the curvature of the surface and is still smaller. Nevertheless it dominates the behaviour of small ripples (capillary waves), whose presence greatly contributes to the roughness (aerodynamic drag) of the sea surface, and hence, to the efficiency with which can generate larger waves and currents. (Van Dorn, 1974)

If each water particle makes small oscillations around its spot, relative to its neighbours, waves can form if all water particles move at the same time and in directions that add up to the wave's shape and direction. Because water has a vast number of molecules, the height of waves is theoretically unlimited. In practice, surface waves can be sustained as high as 70% of the water's depth or some 3000m in a 4000m deep sea (Van Dorn, 1974).
Note that the water particles do not travel but only their collective energy does! Waves that travel far and fast, undulate slowly, requiring the water particles to make slow oscillations, which reduces friction and loss of energy.

Wave motionIn the diagram some familiar terms are shown. A floating object is observed to move in perfect circles when waves oscillate harmoniously sinus-like in deep water. If that object hovered in the water, like a water particle, it would be moving along diminishing circles, when placed deeper in the water. At a certain depth, the object would stand still. This is the wave's base, precisely half the wave's length. Thus long waves (ocean swell) extend much deeper down than short waves (chop). Waves with 100 metres between crests are common and could just stir the bottom down to a depth of 50m. Note that the depth of a wave has little to do with its height! But a wave's height contains the wave's energy, which is unrelated to the wave's length. Long surface waves travel faster and further than short ones. Note also that the forward movement of the water under a crest in shallow water is faster than the backward movement under its trough. By this difference, sand is swept forward towards the beach.

Water waves can store or dissipate much energy. Like other waves (alternating electric currents, e.g.), a wave's energy is proportional to the square of its height (potential). Thus a 3m high wave has 3x3=9 times more energy than a 1m high wave. When fine-weather waves of about 1m height pound on the beach, they dissipate an average of 10kW (ten one-bar heaters) per metre of beach or the power of a small car at full throttle, every five metres. (Ref Douglas L Inman in Oceanography, the last frontier, 1974). Attempts to harness the energy from waves have failed because they require large structures over large areas and these structures should be capable of surviving storm conditions with energies hundreds of times larger than they were designed to capture.

Waves have a direction and speed. Sound waves propagate by compressing the medium. They can travel in water about 4.5 times faster than in air, about 1500m per second (5400km/s, or mach-4.5, depending on temperature and salinity). Such waves can travel in all directions and reach the bottom of the ocean (about 4km) in less than a second. Surface waves, however, are limited by the density of water and the pull of gravity. They can travel only along the surface and their wave lengths can at most be about twice the average depth of the ocean (2 x 4 km). The fastest surface waves observed, are those caused by tsunamis. The 'tidal wave' caused by an under-sea earthquake in Chile in May 1960, covered the 6000 nautical miles (11,000km) to New Zealand in about 12 hours, travelling at a speed of about 900 km/hr! When it arrived, it caused an oscillation in water level of 0.6m at various places along the coast, 1.4m in Tauranga Harbour and 2.4m in Whitianga harbour. Note that tsunamis reach their minimum at about 6000 km distance. Beyond that, the curvature of the Earth bends the wave fronts to focus them again at a distance of about 12,000 km, where they can still cause considerable damage.

The relationship between wave speed (phase velocity) and depth of long surface waves in shallow water is given by the formula
c x c = g x d x (p2 - p1) / p2 or
c x c= g x d for water/air
where c= wave speed, g= acceleration of gravity (9.8066 m/s/s), d= wave depth (or upper layer depth, m), p2= density of water (=1) and p1= density of air (= 0.00125).
The formula states that wave speed increases with wave depth and the relative difference in density.
For an ocean depth of 4000m, a wave's celerity or speed would be about SQR(10 x 4000) = 200 m/s = 720 km/hr. Surface waves could theoretically travel much faster on larger planets, in media denser than water.


For deep water, the relationship between speed and wavelength is given by the formula:
l = g x t x t / (2 x pi)
l = t x c for all kinds of waves, substitute in above equation: t x c = g x t x t / (2 x pi)
c = g x t / (2 x pi) or t = c x 2 x pi / g or t = c x 0.641 (s)
where t= wave period (sec), f= wave frequency, l= wave length (m) and pi=3.1415...
to calculate c and l from wave period t (in sec): c = t x 1.56 m/s= t x 5.62 km/hr = t x 3.0 knot
l = 1.56 x t x t (metres)
Thus waves with a period of 10 seconds, travel at 56 km/hr with a wave length of about 156m. A 60 knot (110 km/hr) gale can produce in 24 hours waves with periods of 17 seconds and wave lengths of 450m. Such waves travel close to the wind's speed (97 km/hr). A tsunami travelling at 200 m/s has a wave period of 128 s, and a wave length of 25,600 m.
Wave speed, period and length with depthThese two diagrams show the relationships between wave speed and period for various depths (left), and wave length and period (right), for periodic, progressive surface waves. (Adapted from Van Dorn, 1974) Note that the term phase velocity is more precise than wave speed.

The period of waves is easy to measure using a stopwatch, whereas wave length and speed are not. In the left picture, the red line gives the linear relationship between wave speed and wave period. A 12 second swell in deep water travels at about 20m/s or 72 km/hr. From the red line in the right diagram, we can see that such swell has a wave length between crests of about 250m.
When the 12s swell enters 10m shallow water (follow the green curve for 10m), its speed will halve to 10m/s (left graph) and so will its wave length (right graph). But the height of the wave increases by a similar factor (not shown here).

The rougher the water becomes, the easier it is for the wind to transfer its energy. The waves become steep and choppy. Further away from the shore, the water's surface is not only stirred by the wind but also by waves arriving with the wind. These waves influence the motion of the water particles such that opposing movements gradually cancel out, whereas synchronising movements are enhanced. The waves start to become more rounded and harmonious. Depending on duration and distance (fetch), the waves develop into a fully developed sea.

Anyone familiar with the sea, knows that waves never assume a uniform, harmonious shape. Even when the wind has blown strictly from one direction only, the resulting water movement is made up of various waves, each with a different speed and height. Although some waves are small, most waves have a certain height and sometimes a wave occurs which is much higher.

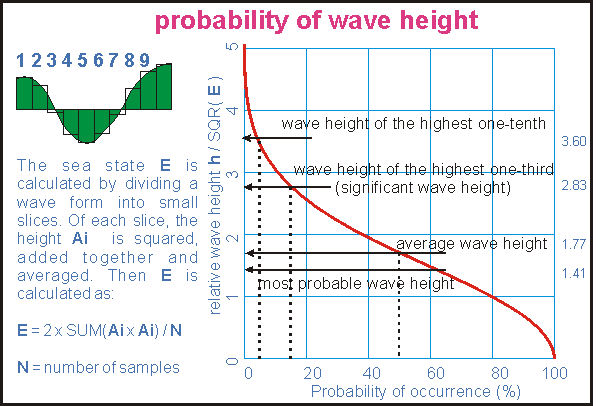
Wave height probabilityWhen trying to be more precise about waves, difficulties arise: how do we measure waves objectively? When is a wave a wave and should be counted? Scientists do this by introducing a value E which is derived from the energy component of the compound wave. In the left part of the drawing is shown how the value E is derived entirely mathematically from the shape of the wave. Instruments can also measure it precisely and objectively. The wave height is now proportional to the square root of E.
The sea state E is two times the average of the sum of the squared amplitudes of all wave samples.
The right part of the diagram illustrates the probability of waves exceeding a certain height. The vertical axis gives height relative to the square root of the average energy state of the sea: h / SQR( E ) . For understanding the graph, one can take the average wave height at 50% probability as reference.

Fifty percent of all waves exceed the average wave height, and an equal number are smaller. The highest one-tenth of all waves are twice as high as the average wave height (and four times more powerful). Towards the left, the probability curve keeps rising off the scale: one in 5000 waves is three times higher and so on. The significant wave height H3 is twice the most probable height and occurs about 15% or once in seven waves, hence the saying "Every seventh wave is highest". Click here for a larger version of this diagram.

Energy spectra for fully developed seasWhen the wind blows sufficiently long from the same direction, the waves it creates, reach maximum size, speed and period beyond a certain distance (fetch) from the shore. This is called a fully developed sea. Because the waves travel at speeds close to that of the wind, the wind is no longer able to transfer energy to them and the sea state has reached its maximum. In the picture the wave spectra of three different fully developed seas are shown. The bell curve for a 20 knot wind (green) is flat and low and has many high frequency components (wave periods 1-10 seconds). As the wind speed increases, the wave spectrum grows rapidly while also expanding to the low frequencies (to the right). Note how the bell curve rapidly cuts off for long wave periods, to the right. Compare the size of the red bell, produced by 40 knot winds, with that of the green bell, produced by winds of half that speed. The energy in the red bell is 16 times larger!
Important to remember is that the energy of the sea (maximum sea condition) increases very rapidly with wind speed, proportional to its fourth power. The amplitude of the waves increases to the third power of wind speed. This property makes storms so unexpectedly destructive.

The biggest waves on the planet are found where strong winds consistently blow in a constant direction. Such a place is found south of the Indian Ocean, at latitudes of -40º to -60º, as shown by the yellow and red colours on this satellite map. Waves here average 7m, with the occasional waves twice that height! Directly south of New Zealand, wave heights exceeding 5m are also normal. The lowest waves occur where wind speeds are lowest, around the equator, particularly where the wind's fetch is limited by islands, indicated by the pink colour on this map. However, in these places, the sea water warms up, causing the birth of tropical cyclones, typhoons or hurricanes, which may send large waves in all directions, particularly in the direction they are travelling.

For the complete series visit: Seafriends.org

Weather Story;

Typhoon Usagi is tracking closer to Japan and expect to hit the island today. To top that one, a small tsunami hit the Japanese Island of Hokkaido, no damage was reported. Tropical Storm Eric is still spinning in he eastern pacific and TS Chantel is off the NHC radar.


RS


Friday, June 22, 2007

Wind, Swell and Rouge Waves

Wind, Swell and Rouge Waves

The wind not only produces currents, it creates waves. As wind blows across the smooth water surface, the friction or drag between the air and the water tends to stretch the surface. As waves form, the surface becomes rougher and it is easier for the wind to grip the water surface and intensify the waves.

Take it to the MAX! Anatomy of a Wave

In Oceanography and Seamanship, William G. Van Dorn provided an example of what the wave heights would be if a steady 33 mph (30 knot) wind blew for 24 hours over a fetch of 340 miles.
  • 10% of all waves will be less than 3.6 ft (1 m).
  • The most frequent wave height will be 8½ ft (2½ m).
  • The average wave height will be 11 ft (3 m).
  • The significant wave height will be 17 ft (5 m).
  • 10% of all waves will be higher than 18 ft (5 m).
  • The average wave height of the highest 10% of all waves will be 22 ft (7 m).
  • A 5% chance of encountering a single wave higher than 35 ft (11 m) among every 200 waves that pass in about 30 minutes.
  • A 5% chance of encountering a single wave higher than 40 ft (12 m) among every 2,600 waves that pass in about five hours.
How big wind waves get depends on three things:
  • Wind strength. The wind must be moving faster than the wave crests for energy to be transferred.
  • Wind duration. Strong wind that does not blow for a long period will not generate large waves.
  • Fetch. This is the uninterrupted distance over which the wind blows without significant change in direction.
Storms of equal size can generate much larger waves in the open Pacific Ocean as compared to the other oceans due to the long open distance of water.

After the wind begins to blow for a while, the waves get higher from trough to crest, and both the wave length and period become longer. As the wind continues or strengthens, the water first forms whitecaps and eventually the waves start to break. This is referred to as a fully developed sea.

Take it to the MAX! Beaufort Wind Scale

"Stolt Surf", North Pacific 1977

The following images are from the chemical tanker ship "Stolt Surf", built in 1970, caught in a large storm in the North Pacific Ocean. The largest waves of the storm broke over the Bridge, more than 72 feet (22 meter) high. Images © Karsten Petersen. Used by permission.

Going into the trough of a wave
Image © Karsten Petersen. Used by permission.

Riding up to the next peak
Image © Karsten Petersen. Used by permission.

Nearly at the crest
Image © Karsten Petersen. Used by permission.

Topping the crest...just to have another huge wave behind it. Image © Karsten Petersen. Used by permission.
The waves in a fully developed sea outrun the storm that creates them, lengthening and reducing in height in the process. There are called swell waves. Swells organize into groups smooth and regular in appearance. They are able to travel thousands of miles unchanged in height and period.

The longer the wave, the faster it travels. As waves leave a storm area, they tend to sort themselves out with the long ones ahead of the short ones, and the energy is simultaneously spread out over an increasingly larger area. As the waves close in on the coast, they begin to feel the bottom and their direction of travel might change due to the contour of the land. Eventually, the waves run ashore, increasing in height up to 1.5 times their height in deep water, finally breaking up as surf.

There are many sailor tales of "rogue waves", "freak waves", "three sisters" and other "killer waves". Properly called "extreme storm waves" these tales were ridiculed and mariners were accused of using them as an excuse to cover their own mistakes in wrecks. Rogue waves are simply unusually large waves appearing in a set of smaller waves.

Some of the characteristics of rogue waves are:
  • their height is greater than twice the size of surrounding waves,
  • they often come unexpectedly from directions other than prevailing wind and waves, and
  • they are unpredictable.
Most reports of extreme storm waves say they look like "walls of water," and are seen as steep-sided with unusually deep troughs. The USS Ramapo reported one such wave with a height of 112 feet in the Pacific in 1933. Another report of a freak wave occurred with it struck the Queen Mary amidships, south of Newfoundland, at the end of World War II, rolling her to within a degree or two of capsizing.

Just recently, a series of three waves, about 70 foot tall, crashed down on the Norwegian Dawn cruise ship in April 2005. The average waves that day were 25 to 30 feet high before these monster waves struck. The watch officer on the Norwegian Dawn stated that all the waves were very large, and that all were roughly the same height. On the third wave, he said, the ship's bow took "heavy green seas", which cascaded directly over the bow and struck the forward part of the vessel’s superstructure.

What causes these enormous waves? Generally they form because of swells, while traveling across the ocean, do so at different speeds and directions. As these swells pass through one another their crests, troughs, and lengths happen to coincide and reinforce each other, combining to form unusually large waves that tower then disappear. If the swell are travelling in the same direction, these mountainous waves may last for several minutes before subsiding.

It is very seldom that huge waves over 65 feet (20 meters) are developed and normally sailors do not even see them, because ships nowadays will try to avoid such conditions by altering course before the storm hits. But they do occur.