Wednesday, July 11, 2007

The NHC Report on Subtropical Storm Andrea

This is the long awaited report on Subtropical Storm Andrea by the NHC. I do have some problems and discrepancies with the report regarding the NHC findings and the data from both the s/v Sean Seamour II and the USCG.

Lets start with;

1. Why does the NHC not monitor and issue Tropical Weather Outlooks prior to June 1 the “official” start of the Atlantic hurricane season?

2. On the announced morning of the storm NWS/NHC stated that winds were NNE 20 to 25, shifting and strengthening to the NNO up to 35, mostly affecting coastal waters. In reality, by 1300 the s/v Sean Seamour II had winds at 60kts, by 1700 they were over 70 with wave structure regular but in excess of 25 feet. By 2100 the sail boat had sustained winds at 74kts, around 2300 hours their new and calibrated windvane read its max capacity at 85.5. The brunt of the system went over the sail boat around 0000 hours and began receding from there on.

3. The first satellite data on 7 July 2007, timed 1547hours. Clearly shows the concentric of a tropical storm in formation, except that I believe when the sat image was taken it was in fact collapsing. Going back to data, at 0100 we still had sustained winds of around 74kts, slowly receding til the sailboat was knocked down at 0245 when wind measurement instruments recorded sustained winds above 70kts. In the sailboats location during Coast Guard extraction USCG rescue personnel claimed winds were still around 70kts around 0830.

4. Another factor that militates to the forming hurricane structure was the wave patterns change which clearly shifted about 30° between 2200hours on the 6th and 0200 on the 7th. Finally, wave structure was far too high for the wind structure that is vaguely address. Again to quote USCG personnel and others irregardless of the s/v Sean Seamour II observations, they had waves well over 70 feet.

5. On the issue of a rogue and or freak wave. I am holding back the reply until I can get confirmation of the NHC position and until I am sure both the NHC and myself have the correct wave data for the exact location when the s/v Sean Seamour II ran into trouble. I will update this as soon as the NHC replies.

These are major discrepancies between forecasts and actual's. I am awaiting a reply from the NHC. Now in all fairness to both NWS and NHC and they will tell you themselves that they forecast based on satellites, buoys, aircraft and computer models and that there can be higher readings in certain spots that they do not have information on. Meaning if NWS/NHC forecast winds at 35mph and waves at 15 feet. There is a possibility of actual's being much, much higher.

I will also add a note to say that QuikScat is mentioned often in the report and it appears that along with other overhead platforms QuikScat is indeed a valuable NWS/NHC asset.

The report...

Tropical Cyclone Report

Subtropical Storm Andrea
(AL012007)
9-11 May 2007

Jamie R. Rhome, Jack Beven, and Mark Willis
National Hurricane Center
1 June, 2007


Andrea formed off the southeast coast of the United States. It was the eighth earliest cyclone since 1851 and the first May cyclone since 1981.

Synoptic History

Andrea formed from a large extratropical cyclone that originated just offshore the mid-Atlantic United States coast on 6 May. This pre-Andrea cyclone deepened steadily that day, with the central pressure falling 16 mb in the 24-hour period ending at 0600 UTC 7 May. The cyclone initially possessed the classic signature of a fully mature extratropical system, with the associated cold front pushing through Florida and reaching as far south as Cuba on 7 May. By late on 7 May, the extratropical cyclone lost most of its baroclinic support and development ended. However, interaction of the low and strong high pressure to the north produced hurricane-force winds. The resulting large area of high winds, along with the slow motion of the extratropical low, generated large waves that impacted much of the coast of the southeastern United States and the Bahamas Islands. On 8 May, the low weakened and began drifting westward over progressively warmer waters in the western Atlantic. Along this track, vertical shear also decreased allowing for the generation of deeper convection around the center. By early on 9 May, convection had become symmetric about the low-level circulation center, the cyclone had lost all of its frontal and cold core structure, and the wind field had contracted. It is estimated that the system transformed into a subtropical cyclone by 0600 UTC 9 May while centered about 150 n mi east of Jacksonville, Florida. The “best track” chart of the subtropical cyclone’s path is given in Fig. 1, with the wind and pressure histories shown in Figs. 2 and 3, respectively. The best track positions and intensities are listed in Table 1.

The cyclone’s weakening continued during the subtropical phase, so Andrea’s peak intensity of 50 kt occurred at 0600 UTC 9 May. Initially, Andrea was trapped within the retrograding middle-to-upper-tropospheric cutoff low that had caused the pre-Andrea extratratropical cyclogenesis. This pattern resulted in relatively weak shear and a slow westward drift of the cyclone. By late on 9 May, Andrea came under the influence of strong northerly flow aloft on the western side of the upper-level low, resulting in increasing vertical shear and a slow southward motion. The increase in vertical shear displaced the strongest convection southeast of the low-level center, and Andrea weakened to a depression by 1200 UTC 10 May while centered about 95 n mi east-southeast of Jacksonville, Florida. Lacking significant deep convection, Andrea degenerated into a remnant low by 0000 UTC 11 May. The remnants of Andrea produced intermittent bursts of deep convection on 11 May while drifting southward just off the central coast of Florida. However, this activity was transient and never acquired sufficient organization for advisories to be re-initiated. The remnant low accelerated northeastward on 12-13 May ahead of an advancing cold front and later became absorbed within the frontal boundary by 14 May.

Meteorological Statistics

Observations in Andrea (Figs. 2 and 3) include satellite-based Herbert-Poteat and Dvorak technique intensity estimates from the Tropical Analysis and Forecast Branch (TAFB) and the Satellite Analysis Branch (SAB), as well as flight-level and dropwindsonde observations from two flights of the 53rd Weather Reconnaissance Squadron of the U. S. Air Force Reserve Command. Microwave satellite imagery from NOAA polar-orbiting satellites, the NASA Tropical Rainfall Measuring Mission (TRMM), the NASA QuikSCAT, and Defense Meteorological Satellite Program (DMSP) satellites were also useful in tracking Andrea. Ship reports of winds of tropical storm force associated with Andrea are given in Table 2, and selected surface observations from land stations and data buoys are given in Table 3. Andrea’s estimated peak intensity of 50 kt as a subtropical cyclone near 0600 UTC 9 May is based mainly on QuikSCAT data. The peak wind of 65 kt during the extratropical phase is based on buoy 41001 located, approximate 150 n mi east of Cape Hatteras, which reported a maximum sustained wind of 55 kt with a gust to 70 kt at 0500 UTC 7 May.

The basis for Andrea’s designation as a subtropical cyclone beginning 0600 UTC 9 May includes conventional satellite imagery, nearby ship observations, and remotely-sensed ocean surface vector winds from QuikSCAT. Dropwindsondes obtained from the Air Force Hurricane Hunter aircraft flown on the morning of 9 May indicate that Andrea had no appreciable horizontal thermal gradients (Figure 4a) and was beginning to acquire warm core characteristics. Specifically, the vertical wind profiles displayed in Figure 4a show winds decreasing with height east of the center, a pattern indicative of a warm core cyclone, with winds increasing with height west of the center, a pattern indicative of a cold core cyclone. Conventional satellite infrared satellite imagery showed convection had become symmetric about the circulation center (Figure 4b), and surface observations and ocean surface vector winds from QuikSCAT showed that the radius of strongest winds had contracted to within 60 n mi of the center (Figure 5).

Rainfall totals over the southeastern United States were generally less than 1 inch and no flooding was reported.

Casualty and Damage Statistics

There were no reports of deaths directly attributable to Andrea as a subtropical storm. However, the pre-Andrea extratropical cyclone was directly responsible for 6 deaths including all four crew members of the 54-foot sailing vessel Flying Colours whose last known location was off the coast of North Carolina on 7 May, a kayaker who died after being pulled out to sea near Seabrook Island, South Carolina on 8 May, and a surfer who drowned after being overtaken by a large wave near New Smyrna Beach, Florida on 9 May. Even though the drowning on 9 May occurred a few hours after the designation of Andrea as subtropical cyclone, most of the wave energy responsible for this death was generated during the pre-Andrea extratropical phase. Additionally, the U.S. Coast Guard rescued 9 people from three sailboats off the coast of North Carolina on 7 May.

Since Andrea never made landfall, most of the resulting damage was associated with the generation of large waves, higher than normal astronomical tides and associated coastal flooding, and associated beach erosion. Most of the significant damage occurred from North Carolina through Florida on 6-8 May as a result of very strong winds and waves associated with the pre-Andrea extratropical cyclone. A storm surge of 2-3 ft was reported in St. Johns and Flagler Counties in northeastern Florida.

The vessel Paris Express encountered high seas in the Atlantic late on 6 May while en route from Savannah to Norfolk, resulting in the loss of 21 containers overboard. The resulting debris washed ashore from Cape Lookout, North Carolina northward to the Virginia border during the following days.

Forecast and Warning Critique

Since Tropical Weather Outlooks are not issued by the National Hurricane Center prior to June 1 (the “official” start of the Atlantic hurricane season), an assessment of genesis forecasts within that product is not possible. However, the pre-Andrea extratropical cyclone, including its associated hazards, was discussed by the National Hurricane Center within several Special Tropical Disturbance Statements beginning with the first issuance on the morning of 8 May.

A verification of official and guidance model track forecasts is given in Table 4. Average official track errors for Andrea were 22, 46, and 67 n mi for the 12, 24, and 36 h forecasts, respectively. For comparison, the average long-term official track errors are 35, 61, and 86 n mi for the 12, 24, and 36 h forecasts, respectively. A verification of official and guidance model intensity forecasts is given in Table 5. Average official intensity errors were 1, 5, and 1 kt for the 12, 24, and 36 h forecasts, respectively. For comparison, the average long-term official intensity errors are 6, 10, and 12 kt, respectively. Both the official track and intensity forecasts were below the average long-term errors.

You can read the rest of the NHC report including the charts and graphs here at the NHC website Subtropical Storm Andrea.

Previous Posts;
Cheating Death On The High Seas
The s/v Sean Seamour II & The Hatteras Trench
High Sea's Update On Sean Seamour II
The Story of the Sailing Vessel Sean Seamour II


RS

Monday, July 9, 2007

The NHC Follies

Ok I am really not interested in politics though its my belief that its time for a real change in the US Congress and the White House. But the hoopla on Bill Proenza the Director of the National Hurricane Center (NHC) is now getting to me. This blog was created for discussions on weather both on land and on the sea. Not the stupidity of bureaucrats and the politics of government. However I am going to kick myself and way in on this subject.

Bill Proenza replaced Max Mayfield this past January. Proenza has a very long history with NASA and NWS in forecasting weather. Let's face facts, Proenza did not get the position of Director of the National Hurricane Center because he did not know what he was doing, politics and Mike Brown aside. The man is qualified for the position. Furthermore, Proenza has a very different management style over his predecessors, he is very much hands. Whereas, the others were very "hands off" and allowed scientists to run with the football. Proenza likes to be not just the quarterback but the offensive and defensive coach as well. Proenza does not seem to play the games, meaning, "keep the complaints in the back room" that his predecessors did. He is very vocal. The heat seems to have started with his statements to the press about NOAA Wasting Millions and then his shot at the failing of the primary communications of the ten year old weather satellite QuikScat.

Last "Thursday, 23 employees - about half his staff - urged the government to removed him immediately". Ok, so half his staff does not like him. What about the other half? They don't count? Yes 99.7% of the staff are professionals and want to do the best they can. I also know that scientists do not take change easily, especially if someone is holding the reins on them. I am not going to start hammering other blogs for jumping one way or the other. We all enjoy free speech and opinion. However I do believe we need to read in between the lines here.

Ok, so we have a new chief, one who has a very different management style, who is very hands on and who is outspoken. So Proenza is upset that Commerce and NOAA spent about 100 Million on PR instead of technology. Well now, that seems to be a problem! Then he spouts off to the press about QuickScat a ten year old weather satellite losing its primary communication and the NHC needing to rely on its back up systems. NOAA spouts back with the press refuting Proenza and basically stating "NO PROBLEM" we got it covered and we will have another and better satellite airborne sometime around 2012. Really? QuickScat was a replacement for another failed satellite, ten years ago and NOAA and Commerce knew ten years ago that QuickScat was not designed for the long term. Ok now, my question. Where in Hurricane Heaven has Commerce and NOAA been for the last ten years? Oh yeah I forgot spending 100 million dollars of taxpayers money on public relations and parties.

Now enters part of the staff, who's complaints include that Proenza is undermining the public trust. By basically, opening his mouth in public and mis-representing facts about the QuickScat Satellite. Like the public does not question the NWS and some weather forecasters on a daily basis as it is now? Funny no mention of NOAA and Commerce blowing 100 Mil eh? Oh thats right, there were super secret, top level, hush-hush-mush-mush, behind closed door meetings with the staff to resolve some important issues! Yep, lets keep the public in the eye of the storm and not tell them that the other side of the storm is about to hit them.

Personally, it does not matter to me what Proenza claims about QuikScat or not. The fact is that the satellite was designed for a life span of ten years to replace another broken bird. The fact is that NOAA and Commerce knew this and have been playing the budget game and spending like drunken sailors. The fact is that some of the staff, according to press reports, seem to like not just the behind the scenes game, rather than being up front with the public. But they don't like hands on people either. What the heck its only our money that all sides are playing with.

So here is my final and only political posting reply. Bill Proenza resigned yesterday as Director and has been temporarily re-assigned. "Temporarily re-assigned"? Ed Rappaport the Deputy Director has been temporarily selected as the new acting Chief. The kinder, gentler chief, I suppose.

Now lets really get down to the facts and have the Office of Inspector General for the US Commerce Department look into all of this and see who is really at fault for here for what? Like I said, what the heck its only our money and I will add, our lives!

Other than that, its time to stop the nonsense now that NOAA, Commerce and "some" of the staff have their boy in slot and get back to work before we have another Katrina and Rita hit the US and NOAA mimic FEMA.

One last thing, who is steering the Congressional Oversight Committee on Commerce? There are some things just as important as, Paris Hilton, Scooter (Convicted) Libby, putting up or not puting up (Berlin) walls along our southern boarder and giving illegal folks a free American pass.

Sheesh, sometimes praying for a hurricane to strike so that everyone can focus on something important sounds like a better deal...

On the Illinois weather side;

Thunderstorms, raced acrossed parts of northern Illinois yesterday some more than 10 miles high, and exploded after a weeks of hot, muggy weather. The powerful storms had gusts that reached a reported 57 mph at Kenosha, 60 mph, south of Algonquin and 50 mph at Romeoville. Parts of McHenry County were drenched by 3” of rain. Moreover, DeKalb County was hit with 50+ m.p.h. gusts, 3/4-inch hail and then a cloudburst which hammered as much as 4.25” of rain. The down pour closed roads, forced the evacuation of one Northern Illinois University dorm, left cars stranded and basements flooded. NWS reported that at the hight of the storm there were more than 2,400 cloud to ground lightning strikes in a single 10 minute period within a 240 miles radius of Chicago.

Update of the s/v Sean Seamour II

Very shortly I will be updating the continuing saga of the s/v Sean Seamour II. I have completed my review of the NHC's report on Subtropical Storm Andrea and am awaiting a response to my questions from the NHC.

RS

Colorado Tornadofest

This is footage from Storm Chaster Roger Hill who on July 3, 2007 in Kit Carson County, captured what he calls Colorado Tornadofest.... Great shots Roger!

Started the day contemplating a chase, but didn’t know for sure if I would. By late morning, strong and rock hard towers were developing south of my house . Just finishing our tours, I was tired, and was headed into town to take care of some mailings. But, seeing the convection south of me, I couldn’t resist. I blasted down I-70 headed for Limon around noon. Shortly after I got on 70, NWS PUB issued a tornado warning for the area southwest of Limon, CO in northeast El Paso county. Radar was pretty clear to see the boundary with various areas of interest along it. However before I even arrived in Limon, the developing cells dissipated.

I decided to go to the Post Office and mail my packages while I was there, and when I came out around 1:30 PM MDT I noticed a rather large area of towering cumulus off to my northeast, northwest of Flagler. More rapidly growing cumulus were developing along the boundary, which was as clear as day. What bothered me was my 91/44 ob at Limon, but noticed much better moisture farther northeast. So, off I went! I headed east bound of I-70 and watched as the towers developed into two young thunderstorms.

About 10 miles west of Flager, and about 5 miles north of I-70, a small tornado developed. This tornado quickly became visible to cloud base with a fairly transparent tube of dirt. It lasted only 4 minutes from 3:14 -3:18 PM MDT. The young thunderstorm farthest west developed a flared base, cork screwed updraft and even a clear slot, so I pushed east to get on it. At 3:21 PM, another debris cloud formed and by 3: 26 PM was completely to could base where a small funnel appeared. By 3:29 PM, the tornado had a rather large pear shaped debris cloud and was simply gorgeous to watch. At 3:31, the next tornado formed just west of it under a new tower. It persisted for 4 minutes before dissipating. Meanwhile the original tornado was continuing to strengthen. At 3:34 PM, a long slender grey funnel appeared just east of the clear slot and at 3:36 PM it touched down. At 3:38 PM two tornadoes criss crossed each other and made for a wild photo op!!! At 3:41 pm the one tornado lifted, while the supercell tornado continued. At 3:45 another tornado formed west of the supercell tornado, and another tornado formed southeast. Quite a wild shot with 3 on the ground at the same time! The farthest west tornado diminished and lifted at 3:49, while the supercell tornado persisted until 3:51. The farther east tornado lifted at 3:53.

Read and see the rest on Rogers site Storm Chase.Net!

RS


Friday, July 6, 2007

Rescue of trapped woman in car


More dramatic video of Coast Guard Air Station San Francisco rescuing a woman trapped in her car during a flood in Northern California.

More Rogue Wave Reports from Cargolaw,

Polish yacht Bloom seriously damaged during a storm off the Russian coast on June 28. German tall ship Alexander von Humboldt rescued the crew, and the Bloom was abandoned at sea. No injuries reported. The Alexander von Humboldt resumed her voyage to Gdansk with the rescued crew. From our Sr. Correspondent Tim Schwabedissen (Thurs. June 28 2007) 238.9-m 36,483-gt 3,450-TEU container vessel M/V Ital Florida (IMO 9308039) homeport Triest built 2007, lost at least three containers in severe seas ebetween June 16 and 19 in the Arabian Sea. The vessel faced waves of 7-10m in height. The ship's deck also suffered storm damage. She arrived in port on June 22 with a substantial port of its containers shifted to starboard and damaged. From our Sr. Correspondent Tim Schwabedissen (Thurs. June 28 2007)

6,469-gt 8,626-dwt 127-m 1977-built M/V DenDen, owned by Eritrean Shipping Lines in Asmara and enroute to Dubai with 8,000 metric tonnes of furnace oil and 24 people, sunk on Tannir Bavi shores in stormy seas on June 23. The vessel was pushed toward the shore. Two confirmed dead, 3 in serious condition and 1 missing. Local fisherman assisted in the rescue of 21 people. From our Sr. Correspondent Tim Schwabedissen (Sun June 24 2007) UPDATE>>> The accident appears to have been the result of an engineer's error, who failed to change engine power at optimum temperature resulting in engine seizure. From our Sr. Correspondent Tim Schwabedissen (Tues. June 26 2007)

UPDATE M/V Pasha Bulker

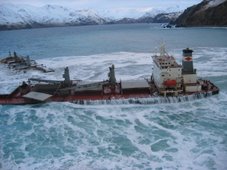
She's alive and kicking, well maybe not kicking too hard but M/V Pasha Bulker tonight was pulled from her temporary berth on Nobbys Beach, Northern NSW Australia by a couple of heavy haulage tugboats who were'nt going to take no for an answer, she quietly slipped out to sea about 9.45pm AEST into the deeper waters that will allow a serious assessment of her hull to take place before she is dry docked for repair. M/V Pasha Bulker appears to have suffered severe damage to her rudder & propeller but in the great scheme of things this is minor compared to what could have become of this young lady of the sea. Also of concern are some creases down her starboard side which could in all reality spell an end to her all-too-short life. Here's hoping for a full recovery and return to duty for this humble lady.

Bruce Traplin - Australia

Editor Note For July 2 2007:

We will follow with additional details concerning the release of M/V Pasha Bulker from her reef prison -- but for now ths is just a happy miracle! Sadly, there is the prospect that this freedom is only parole -- depending upon the damage sustained.

RS


Thursday, July 5, 2007

Pressure builds for storm chief

Seems like the internal struggles within the NHC is still making the news. This article from the Miami Herald.

Weather Notes:
We are reviewing the National Hurricane Centers report on Subtropical Storm Andrea and will post it shortly. In the meantime Storm Chaser Roger Hill captured video of 9 tornadoes in Kit Carson County Colorado. As soon as I get a video link I will post it.

Pressure builds for storm chief

The controversial director of the National Hurricane Center came under additional scrutiny as a federal team of experts conducted an unannounced inspection.

mmerzer@MiamiHerald.com

Bill Proenza, National Hurricane Center director, speaks during the Governor's Hurricane Conference at the Broward County Convention Center in Fort Lauderdale.
JARED LAZARUS/MIAMI HERALD STAFF
Bill Proenza, National Hurricane Center director, speaks during the Governor's Hurricane Conference at the Broward County Convention Center in Fort Lauderdale.

A five-member team from Washington, including a lawyer who specializes in personnel matters, conducted a snap inspection Monday of the National Hurricane Center in Miami-Dade to determine if it can fulfill its mission under current management.

The unannounced visit came in the wake of serial controversies stirred by Bill Proenza, the center's new director, who has been sharply critical of his superiors at the National Oceanic and Atmospheric Administration.

Meanwhile, for the first time, one of Proenza's hurricane forecasters expressed public concern about some of Proenza's actions since he took the job in January.

Lixion Avila, a lead forecaster and a center employee for more than 20 years, said he believes Proenza meant well but unintentionally has undermined public faith in hurricane forecasts.

Proenza has complained about budget shortfalls, what he called a multimillion-dollar ''bogus'' NOAA anniversary celebration and the imminent demise of a key satellite.

He has been careful to say that those issues herald future -- rather than current -- problems, but some people have not grasped the distinction, Avila said.

'I go to the Publix supermarket and they know me and they say, `What's going on at the hurricane center? You can't make a forecast anymore,' '' Avila said. ``I have to tell everybody that I can make a good forecast.

''I tell you this because I already told Bill this,'' Avila said. ``And I want it clear that he didn't do any of this out of malice.''

Several others at the hurricane center harbor similar concerns, though another contingent supports Proenza and worries that NOAA is preparing to oust him -- even as the hurricane season is under way.

AWAITS `SUPPORT'

Reached Monday night, Proenza confirmed the surprise inspection, but -- in a departure from his usual practice -- he said little else.

Asked if he believed his job was threatened by the NOAA inspection team and its mission, Proenza said:

``I await their finding and, hopefully, their support.''

The special ''assessment team'' is assigned to determine if the hurricane center can function with its current resources and ''management and organizational structure,'' according to an e-mail received by center employees Monday and obtained by The Miami Herald.

''I have become aware of concerns about [the hurricane center's] ability to meet its mission,'' NOAA head Conrad Lautenbacher Jr., who appointed the team, said in the e-mail.

``I want to ensure the Center's continued readiness for not only this season but future seasons.''

The team arrived at Proenza's door at 10:15 a.m., later met with much of his staff, and also interviewed hurricane forecasters at a separate location at Florida International University, according to several sources.

The inspectors are due back at the hurricane center today, and Avila, who was not in the office Monday, said he expected to be interviewed.

What will he say if asked about Proenza's future?

Avila: 'My answer to them will be, `You never asked me when you put him in, so don't ask me if he should be removed.' ''

Anson Franklin, NOAA's director of communications, confirmed late Monday that the team was in South Florida. He said its report is due in just three weeks.

Among those on the team: John Guenther, an attorney for the U.S. Commerce Department, which controls NOAA. Guenther has considerable experience in personnel matters, according to Commerce Department records.

''The team includes scientists with decades of experience and an attorney as well,'' Franklin said. ``It's always good to have an attorney.''

He declined to respond specifically to questions about Proenza's future.

''We're just trying to identify any issues that need attention,'' he said.

The developments come after months of controversy ignited by Proenza's public attacks on NOAA and the National Weather Service, which runs the Tropical Prediction Center, which runs the hurricane center.

SATELLITE ISSUE

He has been particularly critical of the agency's failure to prepare a replacement for a weather satellite that already is beyond its designed life span. The QuikScat satellite measures wind speeds over distant areas of the ocean.

Proenza and some experts say certain hurricane forecasts could be 16 percent less accurate without that data, though others say similar information might be gathered from other devices.

He was warned last month by the weather service's director that he needed to be more tactful within the bureaucracy and more measured in his public comments.


Best
RS


Wednesday, July 4, 2007

History of the 4th of July

History of the 4th of July

“Thus may the 4th of July, that glorious and ever memorable day, be celebrated through America, by the sons of freedom, from age to age till time shall be no more. Amen and Amen.”
Virginia Gazette on July 18th, 1777

Schoolchildren in America learn the basic history of the events surrounding the Fourth of July, but the details of this monumental occasion in American history somehow fall through the cracks.

Although July 4th is celebrated as America’s official split from Britain’s rule and the beginning of the American Revolution, the actual series of events show that the process took far longer than a single day.

Taxation without representation! That was the battle cry of the 13 colonies in America who were forced to pay taxes to England’s King George III with no representation in Parliament. As dissatisfaction grew, British troops were sent in to quell any signs of rebellion, and repeated attempts by the colonists to resolve the crisis without war proved fruitless.

The original resolution was introduced by Richard Henry Lee of Virginia on June 7, 1776, and called for the Continental Congress to declare the United States free from British rule.

On June 11, 1776, the colonies’ Second Continental Congress, meeting in Philadelphia, formed a committee with the express purpose of drafting a document that would formally sever their ties with Great Britain. The committee included Thomas Jefferson, Benjamin Franklin, John Adams, Roger Sherman and Robert R. Livingston. The document was crafted by Jefferson, who was considered the strongest and most eloquent writer (nevertheless, a total of 86 changes were made to his draft!) The final version, the document that we know as the Declaration of Independence was officially adopted by the Continental Congress on July 4, although the resolution that led to the writing of the Declaration was actually approved two days earlier.

The following day, copies of the Declaration of Independence were distributed and, on July 6, The Pennsylvania Evening Post became the first newspaper to print the extraordinary document.

On July 8, 1776, the first public readings of the Declaration were held in Philadelphia’s Independence Square to the ringing of bells and band music. All of this had occurred with some of the delegates to the Congress not even present; New York, for example, did not even vote on the resolution until July 9th. (Did you know that that not a single signature was appended to the Declaration on July 4th. While most of the fifty-six names were in place by early August, one signer, Thomas McKean, did not actually sign the Declaration until 1781.)

One year later, on July 4, 1777, Philadelphia marked Independence Day by adjourning Congress and celebrating with bonfires, bells and fireworks.

The custom eventually spread to other towns both large and small, where the day was marked with processions, oratory, picnics, contests, games, military displays and fireworks. Observations throughout the nation became even more common at the end of the War of 1812 with Great Britain.

On June 24, 1826, Thomas Jefferson sent a letter to Roger C. Weightman, declining an invitation to come to Washington, D.C., to help celebrate the 50th anniversary of the Declaration of Independence. It was the last letter, Jefferson, who was gravely ill, ever wrote. In it, Jefferson says of the document:

May it be to the world, what I believe it will be ... the signal of arousing men to burst the chains ... and to assume the blessings and security of self-government. That form, which we have substituted, restores the free right to the unbounded exercise of reason and freedom of opinion. All eyes are opened, or opening, to the rights of man. ... For ourselves, let the annual return of this day forever refresh our recollections of these rights, and an undiminished devotion to them.

In 1941, Congress declared July 4 a legal Federal holiday. Today, communities across the nation mark this major midsummer holiday with parades, fireworks, picnics and the playing of the "Star Spangled Banner" and marches by John Philip Sousa.


Remember today is your, Independence Day.... Make the best of it!

Best RS

Tuesday, July 3, 2007

Blind Man Leads SKYWARN


06/13/2007
Blind man leads Skywarn
By: Ed Kacik , Herald staff

NEWINGTON - Although Roger Jeanfaivre has always had trouble seeing, he remembers being fascinated with lightning and weather when he was growing up. His interest in weather continued even after he lost sight completely at the age of 24. While attending Oak Hill School for the Blind in Hartford, Jeanfaivre became interested in ham radio. After getting his license to operate one, Jeanfaivre would broadcast forecasts he made up."People used to think that I worked for the [National Weather Service]," Jeanfaivre said. Now he does.

People turn to the weather service for information when severe weather strikes. To make sure its information is right, the National Weather Service turns to an organization of amateurs called Skywarn.

"Skywarn provides a very valuable service to the NWS," said Betsey Doane, state section manager for the American Radio Relay League. "We can communicate quickly and directly and provide rapid response to information throughout the state."

Skywarn is made up of independent ham radio operators who are also trained weather spotters. They report wind gusts, hail size, rainfall and cloud formations that signal severe weather.

"Spotters are the people outside during the day. Their weather tools are their ears and their eyes," Jeanfaivre said. "The NWS radar is a few thousand feet up, so they can't see what is happening on the ground."

In 1994, Jeanfaivre became the state Skywarn coordinator and kept responsibility for Hartford and Tolland counties in a 2002 reorganization. He enjoys Skywarn because it allows him to blend two of his favorite hobbies, weather and ham radio, devices that work even when other forms of communication - computers and telephones or cell phones - do not.

Skywarn gathers firsthand reports of severe weather events and feeds them into local forecasts as quickly as it can. Anytime NWS issues a severe weather warning, Skywarn goes to work setting up nets.

"Nets are a gathering of radio amateurs," Jeanfaivre said. "We gather and activate the net and use repeaters ... a setup that takes a little signal and broadcasts it over a wider area which NWS can pick up. Because of the information that we're giving them, NWS can issue a watch or a warning. That's what the public sees on TV or hears over the radio."

During recent thunderstorms, such as one that produced a funnel cloud in Southington and a tornado warning in New Haven County, Jeanfaivre and his team of spotters were at work, verifying the NWS radar images.

Thanks to the evolution of the Internet, NWS can get Skywarn reports in under a minute."In 1994 we weren't tied into the Internet," Jeanfaivre remembered. "With the betterment of the new technology, they can get our reports and it supplements what they see. NWS can link into our system and get the reports as they come in. It's instantaneous." The work is "a joy" for Jeanfaivre.

"It's combining my weather interests with my skills as a communicator," Jeanfaivre said. "It's enjoyable ... We're really not weather forecasters, we're communicators, and it's my job to get the information provided by the spotters to the NWS."

RS

Monday, July 2, 2007

The Cost of Storms 1st Qtr 2007

National Storm Management Reports First Quarter Results

CHICAGO, IL -- (MARKET WIRE) -- 06/28/2007 -- National Storm Management, Inc. (PINKSHEETS: NSMG) reported its first quarter results for the period ended March 31, 2007.

Revenues for the first quarter of 2007 totaled $1.4 million compared to $2.3 million for the same period of 2006. Despite the decline in revenues, income from operations improved to a loss of $777,254 in the first quarter of 2007 compared to $837,714 last year. National Storm posted a net loss of $1.0 million, or $0.01 per share, based on 72.8 million shares, compared to a net loss of $612,824, or $0.01 per share, based on 51.2 million shares for the first quarter 2006 period. During the first quarter of 2007, the company experienced higher interest expense, which increased to $262,246 from $29,078 last year.

"While revenues declined in the 2007 first quarter, we managed to improve income from operations by focusing on cost containment," said Terry Kiefer, president and CEO. "Our operating affiliates have been responding to the significant hail storms that occurred in Lexington, Kentucky, and Akron, Ohio in early June. Operations are currently underway at both locations. We are working diligently to improve revenues for the remainder of the year."

Scott Knoll, chief financial officer, added, "With the completion of our audited fourth quarter and year end results last week, and first quarter financial statements today, the company plans to expeditiously update its registration statement on Form SB-2, which is currently pending review with the SEC to include current financial statements."

About National Storm Management, Inc.

National Storm Management (PINKSHEETS: NSMG) is a national construction company headquartered in Glen Ellyn, Illinois providing storm restoration services in seven states. Its operating affiliates include: ABC Exteriors (Illinois, Indiana and Kentucky); Pinnacle Roofing (Florida and Louisiana); WRS, Inc (Minnesota); and First Class Roofing and Siding (Ohio). The company and its affiliates are recognized by all major insurance companies such as State Farm, Allstate, Farmers and others for storm related claims. The company is a member of the National Roofing Contractors Association (NRCA) and the Better Business Bureau. More information is available at www.nationalstorm.com.

Forward-Looking Statements

Certain statements included in this press release may constitute forward-looking statements. These forward-looking statements relate to, among other things, plans and timing for the introduction or enhancement of our services and products, statements about future market conditions, financial performance, plans to update a registration statement with the SEC, and other expectations, intentions and plans contained in this press release that are not historical fact and involve risks and uncertainties. Our expectations regarding future revenues depend upon our ability to develop and supply products and services that meet defined specifications. When used in this press release, the words "plan," "expect," "believe," and similar expressions generally identify forward-looking statements. These statements reflect our current expectations, but actual results could differ materially as a result of many factors, including, but not limited to, severe weather conditions and the physical damage caused by hail storms and hurricanes, fluctuations in interest rates and the resulting impact on financing costs, general economic developments in the states where we do business, availability of labor, materials and supplies, our ability to execute our future growth plans and our ability to timely and accurately prepare quarterly and annual financial statements. Forward-looking statements are made as of this press release and we do not undertake any obligation to provide updates to such statements except where required to so by law.

Continue reading NSM 1st quarter results.

RS

Friday, June 29, 2007

A Little To Close


These storm chasers really pushed the edge of the envelop by getting way to close to this Oklahoma tornado. But in doing so, they did capture some really fascinating video. However unless there is a scientific purpose in getting close to something as unpredictable as a tornado. The footage is just not worth the risk. These chasers are indeed very lucky.

Weather Notes...

This week Central Region NWS offices started an experimental service called the Weather Story. It’s a graphical forecast product that highlights the most important forecast event for the upcoming 7 days. Usually there is going to be a short write up with each Weather Story. Here is a link to the Twin Cities office Weather Story. To see your local office, just add the 3 letter identifier to the end of the string. Enjoy!


http://www.crh.noaa.gov/wxstory.php?site=lot


Maritime Notes...

New Zealand – update on listing bulker

Maritime New Zealand issued a media release providing an update on the status of the listing bulk carrier anchored in Tasman Bay. Progress to date has steady, but slow. The list has been reduced to 11 degrees. It may take up to 10 days to fully dewater the cargo holds. (6/27/07).

Chaser Pix's

Great pix's from Matt Ziebell!

http://limetap.com/sch/07summary.html

Here's Matt's rundown of where he chased and what he observed:

June 21: Black Hills supercell
June 22: Black Hills brief rotating cell and funnel
June 23: SK and MB supercells and tornado
June 24: Southeast MT supercell
June 25: Northeast WY supercell

Have A Great Weekend!
RS

Thursday, June 28, 2007

The Taharoa Express

As we wait for the National Hurricane Center's report on Subtropical Storm Andrea. Another ship who suffered at the hands of mother nature was reported finally anchored at Tasman Bay, New Zealand.

The 902 foot NKK owned Taharoa Express (formerly known as the "Stellar Cape") a 140,000DWT ore/bulk carrier which was converted into a slurried iron sand carrier was listing some 14 degrees after its load of iron sand shifted while in rough sea about 42 nautical miles (78km) south west of Cape Egmont. Steady progress was being made to right the listing vessel as of this report. Since yesterday, the 25 member crew have been using pumps flown in from nearby Nelson to remove excess water contained in the vessel’s cargo holds. The water is used to help pump in the iron sand and is a normal part of loading operations. Additional pumps may be brought in to help speed up the process.

The pumping operation has so far resulted in the vessel’s list being reduced from 14 degrees yesterday to 12 degrees today.

As we have seen in video's posted on this blog of ship's encountering heavy seas. Wave actions can and do have mechanical effects on not just the ship's general arrangements and superstructure but especially on its cargo. Stress factors associated with these type of wave actions can do some great damage to large ships.

Now imagine a 44 foot sail boat encountering these tyoes of seas.

RS


Wednesday, June 27, 2007

When Thunder Roars, Go Indoors!

Lightning Safety Week:
June 24-30, 2007


Check this site for handouts, indoor safety and outdoor risk reduction tips, medical facts, history, survivor stories, photos, teacher tools and more. Our new kids page now includes a Leon the Lion Safety coloring sheet.

Summer is the peak season for one of the nation's deadliest weather phenomena— lightning. Safeguarding U.S. residents from dangerous lightning is the goal of this Website. The campaign is designed to lower lightning death and injury rates and America's vulnerability to one of nature's deadliest hazards.

In the United States, an average of 62 people are killed each year by lightning. In 2006, there were 47 confirmed deaths and 246 confirmed injuries. The injury number is likely far lower than it should be because many people do not seek help or doctors do not record it as a lightning injury.

People struck by lightning suffer from a variety of long-term, debilitating symptoms, including memory loss, attention deficits, sleep disorders, numbness, dizziness, stiffness in joints, irritability, fatigue, weakness, muscle spasms, depression, and an inability to sit for long.

Lightning is a serious danger. Through this site we hope you'll learn more about lightning risks and how to protect yourself, your loved ones and your belongings. As a start, get an overview of Lightning Safety or stop by our comprehensive page of handouts, brochures, links and more.


NOAA Logo FEMA logo and link 45th Squadron link and logo National Park Service link American Red Cross Logo Lightning Injury Research Program link and logo National Lightning Safety Institute Logo Lightning Strike & Electric Shock Survivors International, Inc. logo and linkStruckbyLightning.org
Little League Logo and link
Minnesota Twins logo and link Vaisala logo and link Lightning Protection Institute logo and link Lightning Safety Alliance link


Tuesday, June 26, 2007

NOAA Satellites ready for Hurricanes

NOAA SATELLITES READY FOR ACTIVE HURRICANE SEASON

NOAA image of hurricane and satellite.June 18, 2007 — With an active Atlantic hurricane season expected for 2007, NOAA’s high-powered satellites are ready to send forecasters a steady stream of crisp, detailed images, and other important data, of any storm that develops in the Western Hemisphere.

The NOAA Satellite and Information Service operates a fleet of spacecraft that monitor the weather, including conditions that trigger hurricanes and the tornadoes and floods that accompany them. “These satellites often provide us with the first indication that a storm is forming and they play an important role in predicting where a storm will go,” said Mary Kicza, assistant administrator for NESDIS.

NOAA’s Geostationary Operational Environmental Satellites (GOES), which operate from a fixed position 22,500 miles above the east and west coasts, take constant images of hurricanes and track their movement. Additionally, NOAA’s Polar-orbiting Operational Environmental Satellites (POES), which operate 530 miles over the Earth, orbiting the entire planet, keep an eye on storms, while providing data — including sea-surface temperatures, which is incorporated into global weather models.

Satellite data is used in combination with hurricane buoys, hurricane hunter aircraft, air-borne Doppler radar, dropwindsondes, and the experience and skill of NOAA’s forecasters to predict tropical storm impacts.

“Our satellites are in good health and are closely watching the oceans for any hint of tropical storm activity,” Kicza added. “Our top priority is to provide the satellite images and data to NOAA meteorologists, who make the forecasts that enable emergency managers to help people get out of harm’s way.”

NOAA Satellite Fleet

NOAA currently has four geostationary spacecraft: two are in operation, one is stored in orbit as a ready backup and one satellite currently used to provide better coverage of South America as part of the World Meteorological Organization’s World Weather Watch Global Observing System. GOES are the nation’s primary hurricane spotters from space.

NOAA also has five polar-orbiting satellites – two that are operational, including a spacecraft in a joint venture with Europe, with three more serving as backup satellites. POES are key in monitoring changes in the atmosphere and ocean temperatures and climate phenomena, such as El Niño and La Niña.

“We have an elaborate system in place, including back-up satellites and partnerships with other nations, that would handle any hiccups and keep monitoring storms,” said Kathy Kelly, director of the NOAA Satellite Operations and Satellite Data Processing and Distribution.

Additionally, NESDIS processes data from other spacecraft, such as NASA’s research QuikSCAT satellite, which is used in hurricane forecast models. “Our forecasters are using research tools like QuickSCAT to develop enhanced forecast models,” said Mary Glackin, acting director of the NOAA National Weather Service. “NOAA’s satellites are a key component to accurate hurricane forecasts, but our focus on next-generation technologies will ensure continued to improvement in hurricane services.”

Just last week, NOAA officially dedicated a new home for its around-the-clock environmental satellite operations. The NOAA Satellite Operations Facility, in Suitland, Md., supports a range of high-technology equipment, including 16 antennas that control more than $4.7 billion worth of environmental satellites. Each day, NSOF processes more than 16 billion bytes of environmental data from NOAA’s satellites and the Department of Defense’s Meteorological Satellite Program.

NOAA image for a larger view of Hurricane Katrina on Aug. 28, 2005, at 9:15 a.m. EDT - Category 5 strength. Also shown is the NOAA GOES-12 satellite, which monitors Atlantic hurricanes. NOAA Satellites Show Moxie
During the 2005 Atlantic hurricane season, when a record 28 storms developed, NOAA satellites sent a total of 11,736 images of these cyclones to forecasters at the NOAA National Hurricane Center in Miami, Fla. In the relatively quiet 2006 hurricane season, the number of images was 7,380. (Click NOAA image for a larger view of Hurricane Katrina on Aug. 28, 2005, at 9:15 a.m. EDT - Category 5 strength. Also shown is the NOAA GOES-12 satellite, which monitors Atlantic hurricanes. Click here for high resolution version. Please credit “NOAA.”)

In New Orleans, ground zero for Hurricane Katrina, the costliest hurricane in U.S. history, GOES sent 716 images of the storm between August 26 and August 30.

“During Katrina, nothing could have been more helpful to forecasters than [NOAA] GOES imagery,” said Paul Trotter, meteorologist in charge of the NOAA National Weather Service forecast office in Slidell, La. “In areas where observations were limited, satellite imagery of the southwest movement of Katrina, once it began to move through and exit Florida, gave tremendous lead time of the eventual curve toward southeast Louisiana.”

Future NOAA Satellites
NOAA and NASA are planning the next generation of satellites that will strengthen the prediction and tracking of hurricanes. Known as the GOES-R series, these next generation satellites are expected to bring key improvements in data for predicting severe weather, including hurricanes. GOES-R data will result in longer watch and warning lead times and a better definition of the threat area for hurricanes and other dangerous weather.

“Since the first GOES satellite began monitoring the weather in 1975, we have never stopped trying to make this system better,” Kicza said.

Also planned for the future is the National Polar-orbiting Operational Environmental Satellite System, or NPOESS. This satellite system also will bring improved data and imagery for better weather forecasts, severe-weather monitoring and detection of climate change.

Relevant Web Sites
NOAA Satellite and Information Service

NOAA National Weather Service

NOAA National Hurricane Center

Monday, June 25, 2007

More Rogue Waves & Sean Seamour II Update


As we await the National Hurricane Centers report on Subtropical Storm Andrea due out this week. The above video is of a ferry encountering heavy seas.

We have a unofficial initial assessment from the NHC regarding the heavy seas encountered by the s/v Sean Seamour II. This was part of an email exchange to me by the NHC, who also asked for other details on the Seamour's location so that there Marine Branch could take a closer look;

"At first glance, buoy 41001 (located approximately 150 nm east of Cape Hatteras at 34.68N 72.66W) is closest to the ships and also reported the highest seas during this event. The highest reported significant wave height was 12.4 meters (40.7ft) with a 14 sec period early on May 07. The typical rule of thumb and theoretical bound using statistical methods would imply the potential for an individual wave to be as high as 2 times the significant wave height or roughly 82 ft. However, a somewhat higher wave seems possible in this case since, in deep water, wave height is typically bounded by the steepness. That is, individual waves will begin to break when their height/length ration exceeds 1/7.

Accordingly to my back of the envelope calculations, that would yield a *potential individual *wave height even higher than 82 ft. Additionally, the 3 ships appeared to be in close proximity to the Gulf Stream. In this case, the wind was opposing (or going in the opposite direction) of the Gulf Stream. Such a condition is known to produce extremely large seas which can exceed values from wave equations alone. Additionally, such conditions also tend to produce very steep seas (very hazardous condition). In fact, many of the accounts of "rogue waves" seem to originate in areas where the wind bucks a strong current. Furthermore, it is unlikely that the worst conditions (highest actual significant wave height) was sampled by this buoy. So it is easy to imagine conditions even worse than what I have outlined above. Still, I suspect ~80 ft is more than enough to capsize a sail boat and inflict serious damage to a cargo ship.

Caveat: Since the NHC is not officially declaring the system subtropical until early May 9, these conditions did not arise during Andrea, but rather the pre-Andrea extratropical cyclone!

I guess the question to ask is whether an 80 ft wave is capable of the damage we saw in Andrea. If the damage can be explained by such a wave, calling it a "freak/rogue" wave might not be the best term. Such a term implies a wave which defies science and thus cannot be explained. In this case, it seems to me that the conditions necessary to produce such damage can be explained. The 3 vessels, unfortunately, found themselves in near optimal conditions for
extremely large wave production."

Fascinating and we await the NHC report.

RS

Friday, June 22, 2007

Wind, Swell and Rouge Waves

Wind, Swell and Rouge Waves

The wind not only produces currents, it creates waves. As wind blows across the smooth water surface, the friction or drag between the air and the water tends to stretch the surface. As waves form, the surface becomes rougher and it is easier for the wind to grip the water surface and intensify the waves.

Take it to the MAX! Anatomy of a Wave

In Oceanography and Seamanship, William G. Van Dorn provided an example of what the wave heights would be if a steady 33 mph (30 knot) wind blew for 24 hours over a fetch of 340 miles.
  • 10% of all waves will be less than 3.6 ft (1 m).
  • The most frequent wave height will be 8½ ft (2½ m).
  • The average wave height will be 11 ft (3 m).
  • The significant wave height will be 17 ft (5 m).
  • 10% of all waves will be higher than 18 ft (5 m).
  • The average wave height of the highest 10% of all waves will be 22 ft (7 m).
  • A 5% chance of encountering a single wave higher than 35 ft (11 m) among every 200 waves that pass in about 30 minutes.
  • A 5% chance of encountering a single wave higher than 40 ft (12 m) among every 2,600 waves that pass in about five hours.
How big wind waves get depends on three things:
  • Wind strength. The wind must be moving faster than the wave crests for energy to be transferred.
  • Wind duration. Strong wind that does not blow for a long period will not generate large waves.
  • Fetch. This is the uninterrupted distance over which the wind blows without significant change in direction.
Storms of equal size can generate much larger waves in the open Pacific Ocean as compared to the other oceans due to the long open distance of water.

After the wind begins to blow for a while, the waves get higher from trough to crest, and both the wave length and period become longer. As the wind continues or strengthens, the water first forms whitecaps and eventually the waves start to break. This is referred to as a fully developed sea.

Take it to the MAX! Beaufort Wind Scale

"Stolt Surf", North Pacific 1977

The following images are from the chemical tanker ship "Stolt Surf", built in 1970, caught in a large storm in the North Pacific Ocean. The largest waves of the storm broke over the Bridge, more than 72 feet (22 meter) high. Images © Karsten Petersen. Used by permission.

Going into the trough of a wave
Image © Karsten Petersen. Used by permission.

Riding up to the next peak
Image © Karsten Petersen. Used by permission.

Nearly at the crest
Image © Karsten Petersen. Used by permission.

Topping the crest...just to have another huge wave behind it. Image © Karsten Petersen. Used by permission.
The waves in a fully developed sea outrun the storm that creates them, lengthening and reducing in height in the process. There are called swell waves. Swells organize into groups smooth and regular in appearance. They are able to travel thousands of miles unchanged in height and period.

The longer the wave, the faster it travels. As waves leave a storm area, they tend to sort themselves out with the long ones ahead of the short ones, and the energy is simultaneously spread out over an increasingly larger area. As the waves close in on the coast, they begin to feel the bottom and their direction of travel might change due to the contour of the land. Eventually, the waves run ashore, increasing in height up to 1.5 times their height in deep water, finally breaking up as surf.

There are many sailor tales of "rogue waves", "freak waves", "three sisters" and other "killer waves". Properly called "extreme storm waves" these tales were ridiculed and mariners were accused of using them as an excuse to cover their own mistakes in wrecks. Rogue waves are simply unusually large waves appearing in a set of smaller waves.

Some of the characteristics of rogue waves are:
  • their height is greater than twice the size of surrounding waves,
  • they often come unexpectedly from directions other than prevailing wind and waves, and
  • they are unpredictable.
Most reports of extreme storm waves say they look like "walls of water," and are seen as steep-sided with unusually deep troughs. The USS Ramapo reported one such wave with a height of 112 feet in the Pacific in 1933. Another report of a freak wave occurred with it struck the Queen Mary amidships, south of Newfoundland, at the end of World War II, rolling her to within a degree or two of capsizing.

Just recently, a series of three waves, about 70 foot tall, crashed down on the Norwegian Dawn cruise ship in April 2005. The average waves that day were 25 to 30 feet high before these monster waves struck. The watch officer on the Norwegian Dawn stated that all the waves were very large, and that all were roughly the same height. On the third wave, he said, the ship's bow took "heavy green seas", which cascaded directly over the bow and struck the forward part of the vessel’s superstructure.

What causes these enormous waves? Generally they form because of swells, while traveling across the ocean, do so at different speeds and directions. As these swells pass through one another their crests, troughs, and lengths happen to coincide and reinforce each other, combining to form unusually large waves that tower then disappear. If the swell are travelling in the same direction, these mountainous waves may last for several minutes before subsiding.

It is very seldom that huge waves over 65 feet (20 meters) are developed and normally sailors do not even see them, because ships nowadays will try to avoid such conditions by altering course before the storm hits. But they do occur.

Thursday, June 21, 2007

Rogue Wave traps four hikers

P.C. Lui of Freaque Waves, has a couple of good articles om rogue waves.

Rogue wave traps 4 hikers
When I first saw this title, I was a little puzzled. How does freaque wave got to do with hikers? Well, this article in the Seattle Times by Maureen O'Hagan tells what had happened to a group of hikers:

The group had set out Sunday for a weeklong hike on the West Coast Trail on Vancouver Island. The trail, about 47 miles long, is as beautiful as it is rugged. There is no road access. And with parts of the trail hugging the ocean, hikers must time their forays to avoid the dangers of high tide. No matter the time of day, the waves crash explosively. The area is known as the Graveyard of the Pacific because of the ships that have sunk there.

So with parts of the trail hugging the ocean, they carefully tried to avoid high tide, can freaque waves to be far behind? It almost sounds like an action movie script, but it's beyond most of the Hollywood script writers imagination:

The rest of Paul's post can be found here Rogue wave traps 4 hikers


RS

Wednesday, June 20, 2007

Tornado's Destruction From Space

Image : A tornado left this scar in a forested region of Wisconsin on June 7, 2007. Image Credit: NASA's MODIS Rapid Response.

A series of tornadoes ripped across central and northeast Wisconsin on the evening of June 7, 2007, leaving a path of destruction visible from space.

This image of the track of one of those tornadoes was captured on June 9, 2007, by the Moderate Resolution Imaging Spectroradiometer (MODIS) on NASA’s Terra satellite. The tornado track is the diagonal line running through the dark green, forested area, just left of the center of the image.

The path torn through this densely wooded area stands out quite clearly in the satellite image, as tens of thousands of trees were leveled by the devastating funnel cloud.

One of the tornadoes to strike the area was given an F-3 rating by the National Weather Service, classifying it as a “strong” tornado that causes severe damage and has wind speeds between 158 and 206 miles per hour.

For more information on the Wisconsin tornadoes:

Earth Observatory: Natural Hazards

For more information on NASA's MODIS Rapid Response:

http://modis.gsfc.nasa.gov/index.php


RS

Tuesday, June 19, 2007

The rescue of the M/V Pusha Bulker


Here is another recent story of a ship running aground off Nobbys Beach (near the extrance to Newcastle Harbour in Australia) after getting into trouble, during gale-forced winds on 8 June 2007.

The m/v Pusha Bulker, owned by Lauritzen Bulkers, is a 738 foot/ 225/m, 76,741 mt, Panama Flagged Bulkcarrier, hauling coal, built in 2006 by Sasebo Heavy Industries Co., Ltd. The Salvage operations is being conducted by s Svitzer Salvage, a division of A.P. Moller-Maersk. It was reported and determined that the ship's hull was breached by the continued pounding of the waves.

As of this writing, the vessel could be stranded until late June and until tides and seas are favorable. Salvage continues, with the 22 member salvage team, stabilizing the ship, preparing it for re-float and transfering fuel and oil to tanks that are higher and not impacted by the waves.

There are some 20 marine and environmental agencies involved in the operations.

As you can see in the video, people lined the beaches in heavy rain and gale-force winds as the rescue operations retrieved the 22 member Filipino crew. Now just imagine the force of this storm that caused this vessel onto the beach.

Here ia another amazing photo, ( Courtesy of Cargolaw ).


This town will never forget the m/v Pusha Bulker. We will keep you posted....

RS

Monday, June 18, 2007

Nine Rescue's In One Day


I have been writing about the s/v Sean Seamour II and its crew that were rescued on 7 May 2007 by the USCG. But this was not the only rescue for USCG Elizabeth City, where they had one C-130 and 3 HH-60 Jay Hawks operational. There were actually six other boaters all rescued on the same day. In total there were nine rescues on this day for Air Station Elizabeth City and its USCG HH-60 Jay Hawk helicopter crews.

The way Subtropical Storm Andrea came in and caught everyone off guard I am surprised that more boaters were not caught in the storm . However, the s/v Flying Colours and its crew are still missing.

This video (USCG Imagery) is of the rescue of the three crew members of s/v Seeker rescued at 0730hrs, 7 May 2007, in the vicinity of Diamond Shoals, N.C.

On the Illinois wether front, its been pretty boring. But the weather has been just great! You know that the weather has to be pretty boring when the main talk on the storm chaser list-serves is "food" ...

Though Storm Chaser Matt Ziebell got some great shots of a super cell and shelf cloud approaching his offiice. Shortly after this photo was taken the Automated Surface Observing System (ASOS) measured an outflow at 62MPH. No tornado though.... Great Shot Matt!


UPDATE 19 June 2007

Received an email from Matt Ziebell correcting my post on the 62mph outflow. Matt goes on to say the 62mph gust was inflow straight out of the east! When the shelf cloud passed, the outflow was around 70mph from the west. There were several large tree limbs that came down before the storm even hit.

NWS Glasgow MT

Best
RS

Friday, June 15, 2007

The Rescue of the s/v Sean Seamour II


I just can't get over the rescue operations that the US Coast Guard performed recovering the crew of the s/v Sean Seamout II. Just to recap, On or around 7 May 2007 the s/v Sean Seamour II was struck by a what is believed to be a "freak wave", during Subtropical Storm Andrea. The sailboat was broadsided by a wave that did an great deal of damage to the boat and sent the crew flying about the cabin doing 360's and causing its Master to break his ribs. The wave caused the sailboat to immediately list starboard.

After a harrowing time riding the waves a EPIRB signal was received by the USCG and a C-130 over fight located the wave riding crew. A J-Hawk Helicopter was dispatched to the area and launched a rescue swimmer, who injured his back during the insertion into the water, when a wave dropped from beneath him and he dropped some 50 to 70 feet. All of this done in 50 to 70 foot seas, with winds estimated at 80 knots.

This video was taken by the rescue helicopter of part of the rescue and though short its just amazing. Again the USCG Rescue Crew did an outstanding job!

I am adding a recent news article on the Gloucester-based dragger Grace Marie and its encounter with a rogue wave on 27 April 2007. Note the damage done to the steel hull by a wave. I have also added the latest reports (from cargolaw) on recent ships encountering rogue or freak waves. Again note the damage and injuries done to these vessels and crew by a wave.

  • Unidentified 32-foot fishing vessel, with crew of 3, was struck by wave causing damage to the vessel's bow and subsequent flooding approximately 45 miles east of Port Aransas, TX. A distress call was received by the crew of an offshore supply vessel who then relayed the message to the Coast Guard. A Coast Guard rescue swimmer and the boat's crew were able to pump water out of the vessel before it sank. A Coast Guard cutter escorted the vessel to Port Aransas for repairs. No injuries were reported. (Tues. June 5 2007)

  • High-speed 279-ton hydrofoil ferry Seven Island Ai , cruising 40 knots from Izu-Oshima Island to Kurihama Port with 207 passengers, struck by rogue wave off Kanagawa Prefecture, approximately 13 kilometers south of Jogashina Island in Miura, on May 19, causing smashed windows , significant flooding and 27 injuries. From our Sr. Correspondent Tim Schwabedissen (Sat. May 26 2007)

  • Passenger M/V Enez Sun, with 136 passengers & 7 crew -- struck by a massive wave off the coast of Brittany in western France May 19 -- 1 man & 1 woman swept off the bridge into the sea near Sein Island. The man broke his arm. They were fished alive out of the water by a trawler that had been alerted to the accident by the coast guard & airlifted to a hospital in the Brittany port of Brest. "We were on the deck, we were looking at the dolphins. We were very close to the island when a huge wave hit us from the side. The seats were ripped loose. I was very afraid," said a passenger. From our Sr. Correspondent Tim Schwabedissen (Mon. May 21 2007)


Previous Posts;
Cheating Death On The High Seas
The s/v Sean Seamour II & The Hatteras Trench
High Sea's Update On Sean Seamour II
The Story of the Sailing Vessel Sean Seamour II


RS