Hurricane Felix (Again these are very early reports!)
Summary
At the last observation, on 2007/09/05 9:00 UTC, tropical cyclone FELIX is a Tropical Depression with maximum sustained wind speeds of 13 m/s (48 km/h, 26 knots). Within 100km of its eye there are 2.7 million people. Within 200km there are 8.4 million people.
The storm is affecting the provinces Valle in Honduras (144.2 thousand people), La Union in El Salvador (371.1 thousand people), Comayagua in Honduras (268 thousand people), La Paz in Honduras (127.3 thousand people), Francisco Morazan in Honduras (0.9 million people), Olancho in Honduras (341.3 thousand people), Yoro in Honduras (401 thousand people), Choluteca in Honduras (355.3 thousand people), El Paraiso in Honduras (275.2 thousand people), Chinandega in Nicaragua (364.4 thousand people), Esteli in Nicaragua (186.6 thousand people), Madriz in Nicaragua (97.8 thousand people), Nueva Segovia in Nicaragua (134.7 thousand people). The closest 6 cities are Tegucigalpa, Comayagua, Talanga, La Paz, Danl¡, El Para¡so.
Atlantic/Caribbean/Gulf of Mexico: Hurricane Felix Tropical Depression Felix
Felix weakened as it moved into Honduras, all coastal watches and warnings are discontinued but flooding danger continues. Maximum sustained winds have decreased to near 30 mph, with higher gusts. The center of Tropical Depression Felix was located near Tegucigalpa. Heavy rain and isolated thunderstorms continue over Nicaragua and Honduras and could produce life-threatening flash floods and mud slides.
Hurricane Henriette
Summary
At the last observation, on 2007/09/05 18:00 UTC, tropical cyclone HENRIETTE is a Tropical Cyclone Category 1 with maximum sustained wind speeds of 33 m/s (120 km/h, 65 knots). Within 100km of its eye there are 505.6 thousand people. Within 200km there are 1.6 million people.The storm is affecting the provinces Sinaloa in Mexico (2.3 million people), Sonora in Mexico (1.9 million people). The closest 6 cities are Yaqui, Navajoa, Huatabampo, La Curva, Campo Cinco, Colonia Militar.
Henriette is a category one Hurricane on the Saffir Simpson scale. Little change in strength is forecast prior to landfall. Maximum sustained winds are near 75mph with higher gusts. Hurricane force winds extend outward up to 15 miles and tropical storm force winds extend outward up to 125 miles from the center. The government of Mexico has replaced the Hurricane Watch and Tropical Storm Warning with a Hurricane Warning along the coast of mainland Mexico from Topolobampo northward to Bahia Kino. Moisture form the remnants of Henriette should make it into the southwestern United States during the next few days.
A non-tropical area of low pressure is located about midway between Bermuda and the northeast Florida coast. The associated shower activity has become more concentrated east of the center. A tropical or subtropical depression could form from this system today as the system moves slowly and erratically. An Air Force Reserve Hurricane Hunter aircraft is scheduled to investigate the system this afternoon.
Maritime Note:
This is an interesting report on wind effects on ships. Thanks Dennis!
The New Zealand Transport Accident Investigation Commission (TAIC) issued the report of its investigation into two recent incidents where strong winds caused restricted limit passenger vessels to heel excessively and lose directional control. The report recommends, among other things, that operators in areas subject to sudden strong winds implement maximum meteorological parameters. MAR 05-212 (8/23/07).
Hurricane Felix has made landfall in Northeast Nicaragua, northeast of Puerto Cabezas. Felix is now a Cat 5 storm.
Felix's current storm position as of Sep 4 - 12:00 UTC is Latitude: 14.3 Longitude: -83.2 with maximum winds of 160 mph and a pressure of 935 mb.
During the morning hours Felix gained Category 5 strength from the warm Caribbean waters. This is a very powerful and dangerous storm.
Up to 40,000 Hondurans were evacuated to shelters but some 15,000 people were unable to find transportation and were forced to ride out the storm in their homes. Its too early to report on any damage but we will be updating through out the day, so stay tuned.....
In the Pacific....
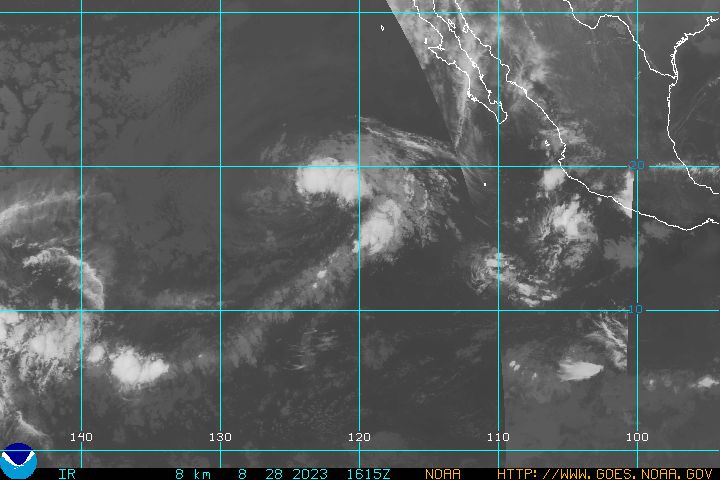
TS Henriette is now Hurrciane Henriette a Category 1 Hurricane with its outer bands approaching the southern tip of Baja California....
Henriette forecast storm position as of Sep 4 - 09:00 UTC was Latitude: 21.4/ Longitude: -109.1 Maximum winds of 75 mph.
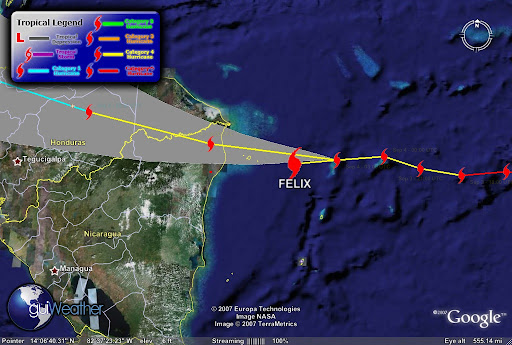
Hurricane Felix a Category 4 and gaining strength. The storms current position as of Sep 4 - 06:00 UTC is approximately 93 miles/ 80 nautical miles (Latitude: 14.3 Longitude: -81.9 off the Nicaragua coastline.
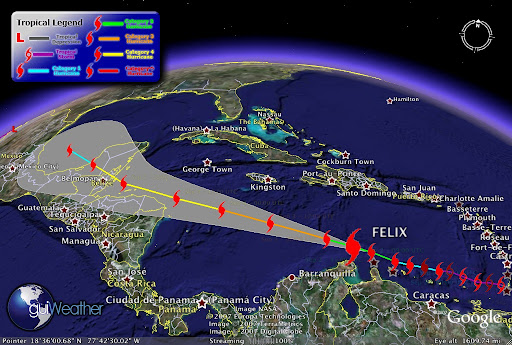
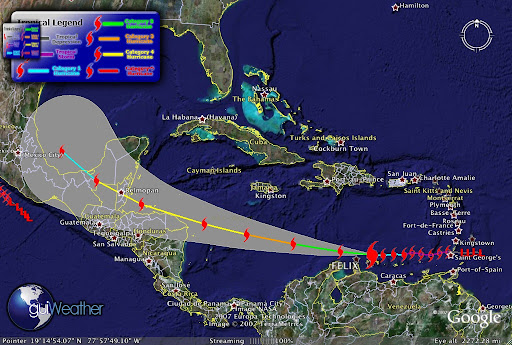
According to guiWeather track (see track below). The storms track indicates that the storm is currently deviating from its westerly track slightly to the south and if it maintains course will pass north of Pureto Cabezas on the Nicaragua coastline. The storm is packing maximum winds of 150 mph with a pressure of 940 mb. Felix is moving toward the west near 20 MPH/32 KM/HR. A south westward track with some decrease in speed expected. The storm has strengthened and may further strengthen before landfall. Hurricane Force winds extend outward up to 35 miles and Tropical Storm Force winds extend outward to 195 miles.
This is a very dangerous storm. The deep ring of red in the satellite photo below indicate intense thunderstorm or intense convection activity ongoing.
The track below also indicates that Felix is driving slightly south of it westerly track and will drive deep into Central America and we can expect tropical torrential rains that can cause major flooding and mud slides in mountainous and low lying areas.
According to press reports," local officials pleaded with residents of Honduras, Nicaragua, Belize and Guatemala to evacuate low-lying areas especially Honduras’ nine offshore islands and otherwise prepare for inevitable disaster". Tourist have been evacuating resort areas jamming area airports.
On the Pacific side...
Tropical Storm Henriette is very close to becoming a hurricane.Henriette is tracking for tourist resorts in Baja California after killing seven people, five of them children, in Mexico's Pacific coastal state of Chiapas. Local Civil Protection Services reported that Henriette dumped torrential rains in Guerrero state on Friday, triggering a rockslide that buried six people in their homes in the resort city of Acapulco. Another man was killed when his vehicle was crushed under another rock slide in jungle ravine in neighboring Chiapas State.
TS Henriette current storm position as of Sep 3 - 18:00 UTC tracking North/Northwest at Latitude: 19.8 / Longitude: -108.3 with maximum winds of 060 knots with gusts to 075 knots.
Central America is preparing for a battering by Hurricane Felix, which now a category four storm as it rages through the Caribbean.
Honduras expects to be hit Tuesday and has issued a hurricane warning for some coastal areas. With wind speeds now around 135MPH.
Felix was well above the minimum force for a category five storm. It comes just two weeks after Hurricane Dean killed 18 people in the region.
This makes Felix as well as Hurricane Dean stronger storms than any typhoons seen in the Pacific this year so far, even though Pacific typhoons are generally more frequent and powerful than Atlantic hurricanes.
Historically there have been 8 Category 5 hurricanes in the past 5 years (Isabel, Ivan, Emily, Katrina, Rita, Wilma, Dean, Felix).
This season there have been two Category 5's Dean and Felix; only three other seasons have had more than one (1960, 1961, 2005).
Felix is an awesome storm to watch. But its destructive power is something that we can do without. Wind shear in the sector is very low and the hurricane is moving into the warmest part of the Caribbean. Amazing drop to 64mb in just 24 hours. I have asked the NHC about this. Though NHC thinkiing is that Felix may diminishing more in intensity when it hits the Honduran coastline and then become a Cat 3 heading toward Belize. Will it pick back up as it enters warmer waters?
We need to watch the track on this storm when it reaches the Bay of Campeche.
Once again I am going to start the blog about something that this blog was not created for, politics and war.
However, serious rumors of war with Iran have now hit my industry and that is not a good sign. Yes I have a political point of view. And since this is not a political blog I will keep my political views to myself.
There are a plethora of blogs both right wing and left wing that can confuse a group of rocket scientists, so just do a web search and knock yourself out if your all ready blindly deposed one way or the other.
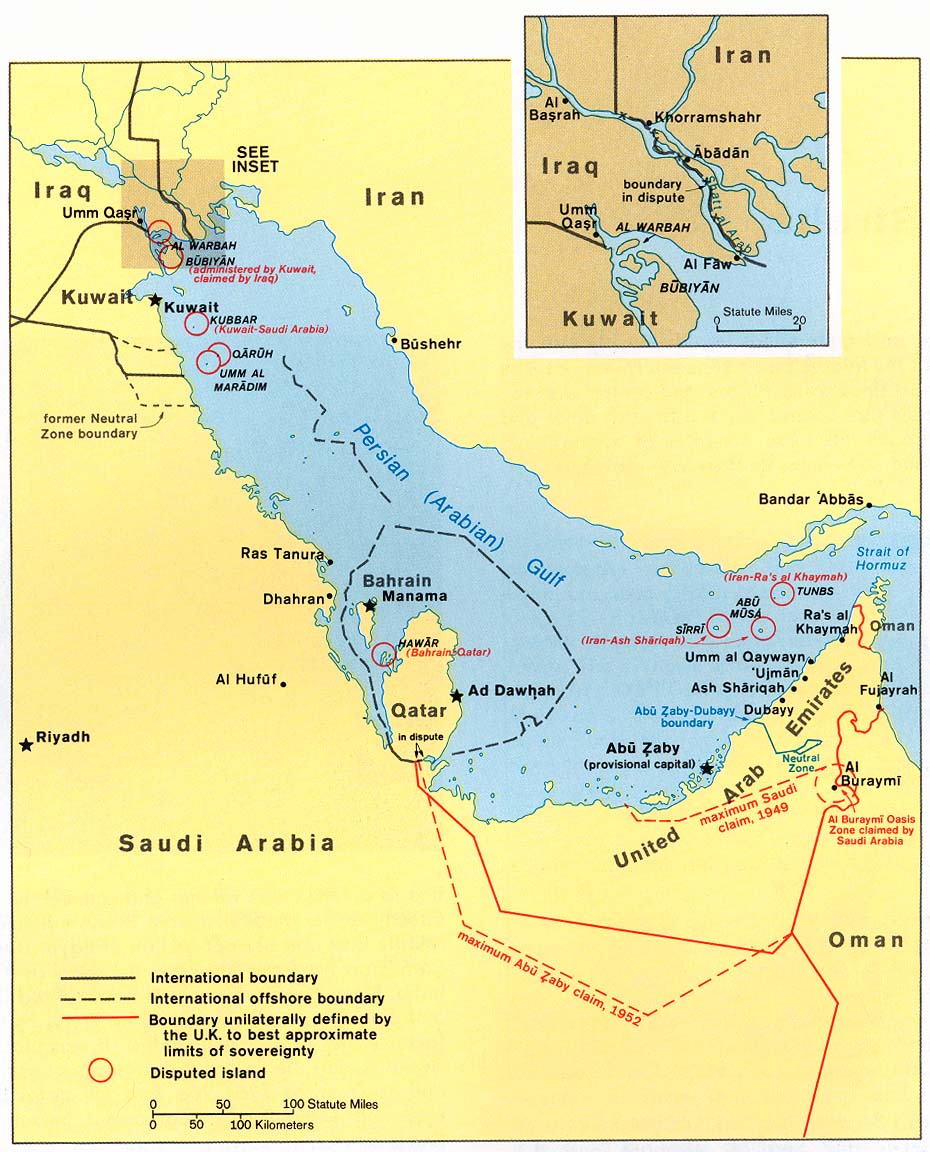
However as a professional marine salvor I wish to take a different approach in discussing the potential of going to war with Iran in the Persian Gulf .
The potential maritime and economic loss of war in the Persian Gulf to both sides as well as the rest of the world.
Most blogs and news reports focus on the ramification of going to war with Iran in terms of terrorism or in military terms. But there is another picture. The economic picture. While I have no great love for the current Iranian regime and since I am sure, that most of the Iranian people do not wish to go to war with the United States, as most citizens of countries normally feel about going to war, unless they are attacked without just cause or buy a political hook, line and sinker. Yes we are not the only ones, try the German people during WWII and they paid a very heavy price, much heavier than anything we have ever paid.
While we are have the freedom of speech and opinion. Most of the time, none of us actually know what is really going on, but we all have some real interesting opinions. So I say to my readers, do not let the media or government meld with your mind, do your own research. And seriously research all sides then come to a conclusion.
Yes the United States Military is very capable of successfully striking Iran. Though we need to remember the British Falklands Island campaign. Ship losses took a heavy toll and we can expect the same thing in the Persian Gulf on both the military and merchant sides.
Daily in the Gulf there are some 30 merchant ships entering and exiting the Gulf every 24 hours. During both the Gulf War and the Iraq/Iran War the US and its Allies escorted some 9000 merchant vessel, even re-flagging some to the US Flag for additional protection. The Persian Gulf is a key economic waterway to the world.
Currently we have three Carrier Battle Groups operating in the Gulf. Depending on the mission each battle group can have as many as 12 or more combat ships within each of its groups. This is not just a strike force but a fleet protection force as well. Protection for both fleets, military and merchant.
Yes we know how and where to strike Iran and the Iranians know, we know, and they know how to strike back. Yes we are prepared to ensure that the Gulf remains open to the merchant fleet. You can also bet that the Iranians are prepared to attempt to close it down as well. They have done it before and odds are they will attempt it again.
So I end here. Not much has changed since the Iraq/Iran war except that weapons systems have advanced 10 fold and yes we have a huge advantage on that frront. But the same navigational and economic concerns and problems in the Gulf still exist.
Listed are some choice studies for my readers to start with. So as the political and media campaign to war starts remember, "do not let the media or government meld with your mind, do your own research" !
Much of Iraq's export capability was lost during the Iran-Iraq War, either to war-related damage or due to political reasons. In 1982, for instance, Syria (allied with Iran at the time) closed the 500-mile, 650,000-bbl/d-capacity Banias pipeline, which had been a vital Iraqi access route to the Mediterranean Sea and European oil markets. By 1983, Iraq's export capabilities were only 700,000 bbl/d, or less than 30% of operable field production capacity at that time.
Iran's revenue share fell after the 1978-79 Iranian Revolution, followed soon thereafter by the Iran-Iraq War for much of the 1980s. All Iranian onshore crude oil production and output from the Forozan field (which is blended with crude streams from the Abuzar and Doroud fields) is exported from the Khark Island terminal located in the northern Gulf. The terminal's original capacity of 7 million bbl/d was nearly eliminated by more than 9,000 bombing raids during the Iran-Iraq War.
The tanker war seemed likely to precipitate a major international incident for two reasons. First, some 70 percent of Japanese, 50 percent of West European, and 7 percent of American oil imports came from the Persian Gulf in the early 1980s. Second, the assault on tankers involved neutral shipping as well as ships of the belligerent states.
The tanker war had two phases. The relatively obscure first phase began in 1981, and the well publicized second phase began in 1984.
From December 2006 to March 2007, Heritage Foundation scholars conducted a computer simulation and gaming exercise that examined the likely economic and policy consequences of a major oil disruption in the Persian Gulf. The exercise utilized a realistic scenario, state-of-the-art macroeconomic modeling, and a knowledgeable team of subject-matter experts from government, business, academia, and research institutes from around Washington, D.C.
This project was a proof-of-principle investigation that combined computer modeling and gaming to capture how U.S. decisions during a crisis might affect how global energy markets and the U.S. economy adjust to sudden and significant disruptions of oil supplies. In this scenario, the United States responded to a crisis precipitated by an attempted Iranian blockade of the Strait of Hormuz.
If anything underscores how geopolitical forces have played havoc with oil prices, it's the latest armed conflict in the Middle East, pitting the Israeli military against Hezbollah guerrillas in open warfare in Lebanon. Already heightened by the U.S.-led confrontation with Iran over its nuclear ambitions, fears about the stability of oil supplies have only increased since the Gaza bombings earlier in July and have intensified sharply since Israel began targeting Lebanon. The outcome is now even more uncertain than it appeared just a few weeks ago.
How long the conflict continues—and whether it spreads to surrounding countries—will determine the future of energy prices, at least in the short run. With Iranian President Mahmoud Ahmadinejad saying on July 25 that the fighting could trigger "a hurricane" of broader war in the Middle East, the prospects look dire to many observers—especially oil traders—around the world.
Having survived higher energy prices relatively unscathed so far, the U.S. economy is more sensitive to costlier oil now than it was a year ago. Inflation, even excluding energy, has accelerated, leading the Federal Reserve to raise interest rates 425 basis points in response. Consumers are already spending more than they earn. And Standard &Poor's expects the economy to slow down to 2.5% growth in gross domestic product in 2007 from an estimated 3.5% in 2006.
UNCERTAINTY PREVAILS. The falloff in U.S. growth means it takes a smaller shock to cause a recession than it did a year ago. Continued strong world oil demand, with usage in both China and Europe accelerating, will continue to put rising pressure on oil supplies despite a U.S. slowdown, thus raising the odds of an oil price surge causing a U.S. recession.
Whether the current Mideast conflict causes a recession depends mostly on how big the impact on oil supplies and prices becomes. This is still highly uncertain. At Standard & Poor's, we continue to believe that the most likely outcome is that cooler heads will eventually prevail and that oil prices will drop back from current peaks. (Of course, there are other, non-military factors—like hurricanes or production disruptions on the order of BP's [BP ] Aug. 6 closure of its Prudhoe Bay field in Alaska—that could have an effect as well [see BusinessWeek.com, 8/7/06, BP's Pipeline Trouble].)
In his first ‘Chairman’s Report’, in the 1984 Annual Report, Jim Rand noted that “promotion of free enterprise and safety at sea are key issues for INTERTANKO”.
Further, he added that “free competition has also for centuries been a cornerstone of American society”. Perhaps someone should have told the United States Congress. Although, for a change, no flag preference proposals gained any speed in Congress, American proposals for taxation of foreign shipping were tabled in 1986. These proposals required tax returns from foreign owners and planned to levy taxes according to American theories of the owner’s domicile rather than the ship’s flag - a burdensome intrusion.
American tax was not the main feature of this time. This was provided by the more spectacular events in the Middle East Gulf, where the Iran-Iraq War now made the waters of the Gulf one of its main theatres. Both sides routinely attacked non-military shipping regardless of its association in any way with either of the combatants.
In 1984, eleven Very Large Crude Carriers (VLCCs) were damaged beyond repair by military strikes. More seriously, 25 sailors were killed and 25 more injured in the attacks. Some tanker owners refused to sail their ships to load at the Iranian export terminal at Kharg Island, despite high freight rates obtainable.
Back to the Weather!
Latest on Hurricane Felix:
Felix becomes a Category Five!!
Felix's projected path is just north of Honduras, then Belize one more time!
Hurricane Felix is now a "major" Category 3 hurricane as it rages over the warm waters of the Caribbean, aimed at Central America or Mexico's Yucatan Peninsula, NWS and NHC weather forecasters report.
Felix passing Aruba!
Latest Track!
FELIX -Current Storm Position as of Sep 2 - 18:00 UTC -Category 3 Hurricane Maximum winds of 125 mph and a pressure of 964 mbLatitude: 13.4 Longitude: -71.2
Well we have number two of the season and its name is FELIX and its a CAT 2
Its current storm position as of Sep 2 - 09:00 UTC. Latitude: 12.8 Longitude: -68.7 heading for the island of Aruba. Maximum winds of 100 mph and a pressure of 984 mb.
As of Sep 2 - 05:26 UTC. Hurricane Hunter KNHC AF306 just ahead of the storm reports, Altitude of Plane: 10036 feet. Wind Direction: 280°. Wind Speed: 32 knots. Temperature: 5°C Dewpoint: 5°C.. The storm was upgraded from a tropical storm to a Category 1 hurricane Saturday evening, becoming the second Atlantic hurricane of the season.
It had sustained maximum winds of at least 80 mph early Sunday. A tropical storm warning and hurricane watch were in effect for Aruba, Bonaire and Curacao.
At 2 a.m. EDT, Felix was centered about 45 miles northeast of Bonaire and 145 miles east of Aruba and was moving westward at about 18 mph, the U.S. National Hurricane Center said.
Forecasters said satellite images showed Felix steadily expanding in size.
Earlier in the day Felix brought heavy rains and strong winds to Grenada as a tropical storm, snapping small boats loose from their moorings, temporarily knocking out local radio and TV stations and toppling utility lines. No injuries were reported.
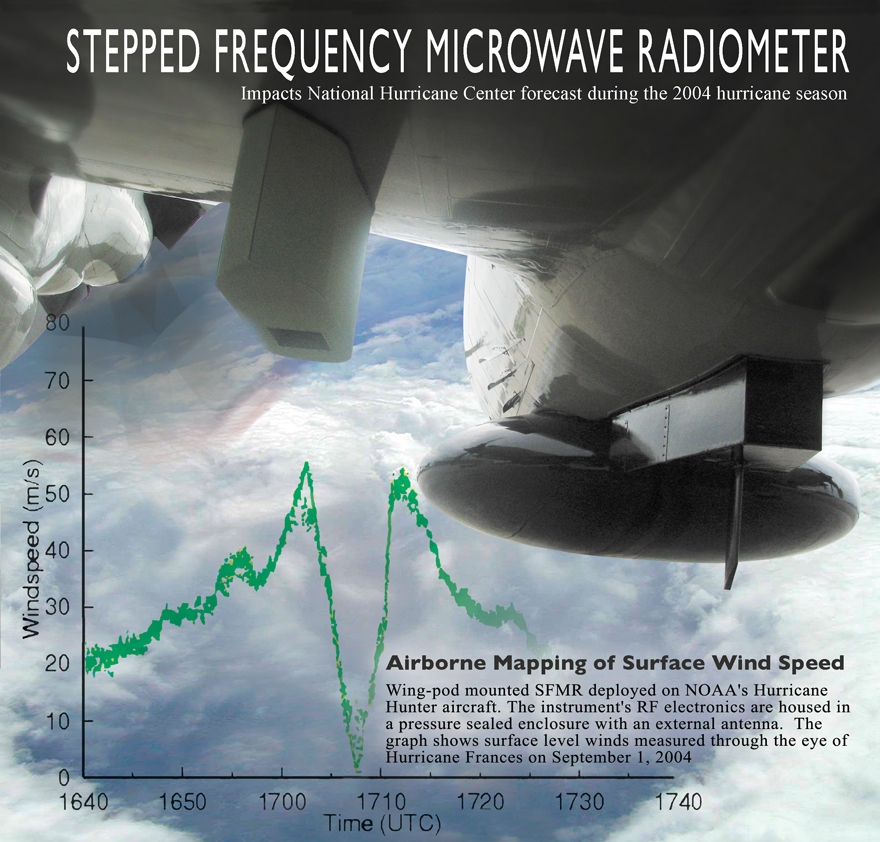
Two years ago Hurricane Katrina kicked the U.S. government's ass. Now, as Hurricane Dean sweeps past Jamaica on its way to the U.S. Gulf Coast, FEMA, the Coast Guard and the other military services are poised to prove they can do better the second time around. The military response actually began days ago when the Air Force's WC-130J hurricane-hunting patrol planes deployed brand-new sensors to more accurately predict when and where Dean will hit and what kind of damage it will do, according to the service. The "Stepped-Frequency Microwave Radiometer," or "smurf,"
allows the Citizen Airmen of the Hurricane Hunters to constantly measure surface winds directly below the aircraft. The smurf can also determine rainfall rates within a storm system. This, in addition to wind speeds at flight level, provides structural detail of the storm. "The SFMR will be the biggest advance I can think of to improve hurricane intensity forecasts," said Max Mayfield, former director of the [National Hurrican Center].
The data collected by the Hurricane Hunters increase the accuracy of the NHC forecast by 30 percent, a rate which will undoubtedly increase with the use of the smurf. This data enables the NHC to more accurately predict the path of storms in order to save lives and narrow areas of evacuation, according to NHC forecasters.
U.S. Air Force Fact Sheet
STEPPED-FREQUENCY MICROWAVE RADIOMETER
PURPOSE:
The Stepped-Frequency Microwave Radiometer is a state-of-the-art instrument designed to continuously and accurately measure the winds at the ocean's surface directly below the aircraft. The SFMR, affectionately known as "smurf", is installed on the WC-130J within a pod attached to the aircraft's wing. As the plane flies through a storm, the SFMR senses microwave radiation naturally emitted from foam created on the sea by winds at the surface. Computers then determine wind speeds based on the levels of microwave radiation detected. Currently, winds are extrapolated from the winds at the aircraft's altitude or from a dropsonde released from the aircraft, however, the SFMR directly measures the surface winds and is not confined to a single point like the dropsonde. This constant measurement of surface winds gives the National Hurricane Center a more complete picture of the storm.
The SFMR can also determine rainfall rates within a storm system. This, in addition to wind speeds at flight level, provide structural detail of the storm.
Two Hurricane Hunter aircraft will be equipped with the SFMR by the end of June with one added each month until all 10 WC-130J aircraft are outfitted with the SFMR pod, the last to be equipped in March, 2008.
SPECIFICATIONS:
Radiometer Type Hatch Tuning bandwidth 4.6 -7.2 GHz Number of channels Up to 8 Receiver Channel Bandwidth 50 MHz Antenna Type Corrugated horn Antenna Beamwidth (3 dB) 20-28 deg Polarization Linear Measurement precision 0.17 K (1second averaging) Electronics Power Requirements 28VDC, 2A Thermal Control Power Requirements 28VDC, 4A (max) Power 168 W Operating Temperature -65°C to +40°C Humidity 0 to 100% Size (L x W x H) 24" x 11" x 13" Weight 40 lbs.
WP-3D Stepped Frequency Microwave Radiometer (SFMR)
Measurement of the hurricane surface wind field, and in particular the estimation of wind maxima, has long been a requirement of the Tropical Prediction Center/OAR. The NOAA/Hurricane Research Division's Stepped-Frequency Microwave Radiometer (SFMR) is the prototype for a new generation of airborne remote sensing instruments designed for operational surface wind estimation in hurricanes.
The SFMR has a downward pointing antenna which passively reads the microwave radiation coming from the ocean surface. By making assumptions about the vertical structure of the atmosphere together with sea surface temperature measurements by a downward-looking airborne infrared radiometer, reasonable estimates of the ocean surface brightness temperature can be made at six frequencies between 4.6 and 7.2 GHz. Wind speeds are then calculated assuming linear increase in wind speed with these brightness temperatures. Since some of the frequencies are more attenuated by rainfall than others, an estimate of the rainfall rate below the airplane can also be made.
Well we have Tropical Storm Gil and Tropical Depression ELEVEN E(RESOE EDIS) off the Pacific Coast that we are keeping an eye on. There are also a couple of interesting tropical waves forming off the African Coast (see Tropical Weather Outlook and Storm Watch-Carib interactive graphics- left side of page)!
Chicago Weather for the weekend? Just great! Have a wonderful Labor Day Weekend!
NOAA NATIONAL WEATHER SERVICE SEVERE WEATHER WARNINGS TO PROVIDE MORE PRECISE LOCATION THIS FALL
Jan. 16, 2007 — The NOAA National Weather Service will introduce this fall storm-based warnings for tornadoes, severe thunderstorms, flash floods and marine hazards that are more geographically specific for these short-duration weather events. Currently, such warnings are issued county wide. (Click NOAA image for larger view of NOAA Storm-based Warnings by county versus the more geographically specific locations due to take effect in October 2007. Please credit “NOAA.”)
"Weather doesn't follow geopolitical boundaries," said retired Air Force Brig. Gen. David L. Johnson, director of the NOAA National Weather Service. "Storm-based warnings provide the public with more specific information about the location of severe weather and the direction it is expected to move. Seconds count during tornadoes and flash floods. We want to provide the public with the most accurate description of what's happening in their neighborhood. We also want to avoid warning non-threatened portions of the county."
When issuing a warning, the NOAA National Weather Service will specify areas within a county and refer to commonly known landmarks such as highways or rivers.
"This is a fundamental change in our warning procedures and a major enhancement in our service capability," said Johnson. "Storm-based warnings will drastically improve graphical displays and empower the private sector to easily distribute the information through Web-enabled PDAs, cell phone alerts, pagers and other technologies. Communicating severe weather threats in this way is imperative in today's digital world." (Click NOAA image for larger view of the improved NOAA Storm-based Warnings due to take effect in October 2007. Please credit “NOAA.”)
The new warnings will take effect October 1, 2007.
NOAA, an agency of the U.S. Commerce Department, is celebrating 200 years of science and service to the nation. From the establishment of the Survey of the Coast in 1807 by Thomas Jefferson to the formation of the Weather Bureau and the Bureau of Commercial Fisheries in the 1870s, much of America's scientific heritage is rooted in NOAA. NOAA is dedicated to enhancing economic security and national safety through the prediction and research of weather and climate-related events and information service delivery for transportation, and by providing environmental stewardship of the nation's coastal and marine resources. Through the emerging Global Earth Observation System of Systems (GEOSS), NOAA is working with its federal partners, more than 60 countries and the European Commission to develop a global monitoring network that is as integrated as the planet it observes, predicts and protects.
Our good freind Dr. Paul C. Liu of Freague Waves is reporting on two exciting new books. "It is a real life story, not a fiction, but it happened in November 22, 1980 over a decade before Sebastian Junger's Perfect storm."Take a look!
The roughness of the oceans has important consequences for seafarers and coastal communities, and is linked to the global climate system through atmospheric circulation and winds. Satellite altimetry brought a global perspective on ocean wave climate (Chelton et al., 1981). With the accumulation of lengthy and carefully validated datasets from a number of satellite altimeters, it is now possible to evaluate the seasonality and inter-annual variability of wave climate globally to a resolution of the order of 100km.
Measuring Waves with Satellite Altimeters
By convention, significant wave height is defined to be four times the root-mean-square elevation of the sea surface, and is a standard statistic for the roughness of the sea surface. Satellite altimeters measure the roughness of the sea through the blurring of the leading edge of the reflected pulses by the uneven surface. Altimeter estimates of significant wave height are corrected by calibration with high-quality buoy data (Challenor and Cotton, 2001). Altimeters only measure the roughness of the sea in a small footprint (~10km diameter) immediately below the satellite. The data sampling is sparse, but sufficient to establish monthly mean significant wave heights on a 2o latitude by 2o longitude grid, or better if more than one satellite is operational. The gridded data sets are constructed from median values of individual "passes" across each grid box. Wave heights vary rapidly close to coasts. Also, the altimeter cannot measure waves if its footprint overlaps land. Therefore, the gridded altimeter datasets provide an offshore climatology only. Data along individual satellite passes can be analysed to extend analysis nearer shore, but even then the sizeable footprint of the altimeters is a limitation. Other methods are necessary to describe waves within 10km of the coastline.
Passes in the vicinity of United Kingdom
(Topex/Poseidon/Jason in Black, ERS-&2/Envisat in Red)
Global Wave Climatology
Average significant wave height can be measured monthly over the globe by satellite altimeter. Wave height varies regionally and seasonally, monthly means mostly varying between 1 metre and 5 metres. Generally, the sea is rougher at high latitudes (North and South) than in the tropics. Wave climate in the extra-tropical North Pacific and North Atlantic is especially seasonal with much rougher conditions in the northern (boreal) winter than in the summer. The Southern Ocean is roughest in the southern (austral) winter, but is very rough throughout the year. Nearer the equator, larger waves can be either swell propagating from higher latitudes, or can be the result of seasonal winds (e.g., monsoons and tropical storms). The Arabian Sea is particularly rough from June to August coinciding with the Southwest Monsoon.
The seasonal and regional wave climate can be summarised by fitting a sinusoidal function of annual period to the monthly mean significant wave heights for each grid square. At each location, the seasonality can be represented by the annual mean, the timing of the maximum wave height (phase of the sinusoid) and the range (twice the amplitude of the sinusoid).
Global Seasonality of Waves. Top: Annual Mean (metres); Middle: Annual Range (metres); Bottom: Phase (peak in months)
North Atlantic and British Isles
There is evidence that the North Atlantic Ocean grew considerably rougher between the 1960s and 1980s, during the age of the ocean weather ships, at least at a few isolated stations (Bacon and Carter, 1991). Is this natural variability or global warming? A new perspective is brought by analysis of satellite data.
The seasonality of wave climate around the British Isles is derived from monthly gridded altimeter measurements over five complete years (1993-1997). The ocean relatively rough throughout the year, while more sheltered regions, for example around south east England, are relatively calm. The seasonality varies slightly from region to region. For example, the spring tends to be slightly rougher than the autumn to the north west of the British Isles, but the reverse is generally true in the North Sea and the Southwest Approaches.
Seasonality of wave climate around the UK
The seasonal cycle is a fair representation of the average climate in the 1990s. However, there is also a great deal of variability about the mean in individual years. This is especially true during the winter months in the Atlantic and Atlantic margins, with monthly mean significant wave heights changing by up to a factor of two from one year to the next. The most obvious candidate as a source for this variability is the North Atlantic Oscillation (Hurrell, 1995), which has a widespread effect on many facets of climate, particularly in the months of December to March. We use gridded mean significant wave heights from these four calendar months in six consecutive winters, 92/93 -97/98. For each of the 24 months, "anomalies" are calculated by subtracting the mean seasonal cycle. Principal component methods are used to derive a spatial pattern of significant wave height anomalies whose time-dependent amplitudes are maximally correlated to an NAO index (Jones et al., 1997). A model for the anomalies is constructed by using the spatial pattern to calculate coefficients of a linear model relating the monthly anomaly to the monthly NAO index.
Inter-annual variability of wintertime wave climate
(above, spatial pattern of 1st eof; below, principal component (red crosses) and NAO Index (black squares)
The performance of the model is illustrated at a single location (57o-58oN, 8-10oW) on the edge of the Hebridean shelf. This location is typical of the region to the north west of the British Isles where inter-annual variability is greatest. Measured anomalies in excess of 2 metres (above or below the means of about 5 metres in each of the four calendar months) are recorded. These anomalies are well described by the relationship to the NAO. In other regions around the British Isles, the variability is lower and the model is less successful in describing this variability. However, the NAO is apparently a factor in determining wave climate throughout the area with the exception of the East Coast of England and Scotland.
Satellite altimetry provides a consistent coverage of wave climate around the British Isles. Previously, wave climatologies were constructed from measurements at a variety of sites and times (Draper, 1980 and 1991). The new climatology is based on measurements in the 1990s and reflects changes in wave climate since earlier decades (Bacon and Carter, 1991; Alcock and Rickards, 2001). Satellite data indicates that an upward trend in wave heights continued from the late 1980s into the early 1990s (Carter, 1999), but the behaviour during the 1990s was erratic. This behaviour can be explained by the NAO, which shifted towards more positive index values between the early 1960s and late 1990s before dramatically switching to its negative phase in the winter of 95/96. The relationship to the NAO is robust and can be used to hindcast the wave climate in much earlier times (Woolf et al., 2002).
Validation of NAO relationship at OWS Lima, extending back to the 1970s.
Behaviour of the NAO in recent decades (9-year running mean)
Hindcast of recent changes in wave height due to NAO.
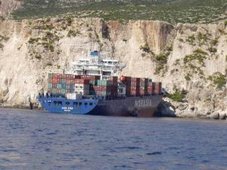
MASTER ENDEAVOUR driven aground by hurrican 'Dean', in Fort de France bay (Martinique - FWI), night 16-17 Aug 2007. The ship was anchored in the bay without crew, under arrest for drug smuggling.
The Maritime New Zealand report of the M/V Aratere incident has just been released. while it was determined that the vessel was constructed to take the large wave pounding.
I want you to note the damage done to this vessel, its crew and passengers.
Imagine a 44 ft sailboat like the Sean Seamour II taking these waves?
Maritime New Zealand issued the report of its investigation into the incident onboard a passenger ferry that experienced heavy rolling and cargo shifts during severe weather. Four passengers and one crewmember were injured and there was significant cargo damage. The report recommends, among other things, further review of weather parameters for Cook Strait crossings and improved training of bridge personnel for ship handling in heavy weather. (Report pdf Aratere 8/23/07).
The ships particulars include: Year Built 1998. Builder: Astillero Barreras, Spain. Introduced: 1999. Gross tonnage: 12,300 t. Flag: New Zealand. Passenger capacity: 369. Rail wagon capacity:60 (425 m). Car capacity: 230. Length: 150m. Breadth: 20.25m. Maximum speed: 19.5kt. Engines:2x Wartsila type 8L32 diesel engines, each producing 3,680 kW.
We previewed this vessel the Strait Shipping Company "Suilvan" back on June 8, 2007 with a post titled "Another Plane Of View". Speaking about how large waves effect large ships with this video from a shore-base view.
Aratere heavy weather report released
Thursday, 23 August 2007, 12:13 pm Press Release: Maritime New Zealand Media release
DATE
STRICTLY EMBARGOED UNTIL NOON 23 AUGUST 2007
Aratere heavy weather report released
Improvements have been made to the way Cook Strait ferries are operated in rough weather following a thorough investigation into the heavy rolling of the Aratere on 3 March 2006.
In releasing Maritime New Zealand’s final report into the incident today (Thursday 23 August), Director Catherine Taylor said while the vessel was capable of withstanding the heavy rolls it encountered, all parties involved accepted that passengers should not have been put in such a position.
“Passenger safety is Maritime New Zealand’s number one priority. This is why we’ve conducted a rigorous investigation, which contains 14 safety recommendations that have already been implemented to improve heavy weather sailing in Cook Strait. This is to ensure that passengers aren’t placed in a situation like this again.”
The report found that during the voyage in rough seas, the Aratere rolled twice to about 50 degrees, with a third roll of approximately 30 degrees occurring when an attempt was made to turn the vessel into the weather.
“Maritime New Zealand considers that although the Aratere itself was sound and was capable of handling the rough seas it encountered, this was still a very serious incident which was understandably very upsetting and uncomfortable for many on board.”
The heavy rolling caused minor injuries to five of the 381 people on board and caused some cargo to break free, damaging rail and vehicular freight. The Aratere arrived safely in Picton several hours later. Other vessels operating in Cook Strait at the same time completed their voyages without incident.
Ms Taylor said MNZ’s final report had considered a wealth of evidence, including eye witness accounts, the advice of overseas experts and technical information from the ship’s voyage data recording instruments. “Based on this evidence, MNZ has concluded that a combination of factors caused the Aratere to roll heavily. While the heavy rolling would have been alarming for those on board, the technical evidence we received appears to conflict with reports that the ship was in serious danger.”
Ms Taylor said the final report also considered the seamanship displayed during the voyage, including the actions of the master and bridge team, as well as issues relating to the cargo lashing system.
“While the report found that the decision to sail was reasonable based on the information available at the time, both Interislander and Maritime New Zealand consider that teamwork on the bridge following the first heavy rolling incident was not functioning as effectively as it should have been.
“Both organisations have been working closely together to address this issue and have implemented a number of safety recommendations.”
Among the actions taken by Interislander is a full review of decision-making relating to rough weather crossings, additional training for ferry masters and crew, improvements to cargo lashing systems and significant investment in overhauling and upgrading the ferries Aratere, Arahura and Kaitaki. Maritime New Zealand has also improved its process for distributing information to ferry companies.
“The purpose of all incident investigations is for the parties involved to learn from them to improve safety, and this is exactly what has happened in this case. Maritime New Zealand’s number one priority is, as always public safety, and we will continue to work with all ferry operators to ensure that the Cook Strait remains a safe place for all to travel.”
Ms Taylor said the report commended the Aratere’s on-board staff for the level of care they displayed towards the passengers during the voyage, and the way in which they kept them informed of the developing situation.
The Transport Accident Investigation Commission also today released its final report into the incident.
ENDS
Safety Recommendations implemented following 3 March 2006 incident
1. It is recommended that Maritime New Zealand:
- Facilitates discussions between the Interislander, Strait Shipping, Wellington Regional Council, Marlborough Regional Council, and the Wellington and Marlborough Harbourmasters through the Cook Strait Ferry Review. These discussions should consider appropriate weather parameters for ferry sailings, including the need for harbourmasters to be consulted on the appropriateness of ferries sailing when wave heights and wind speeds reach certain levels. These discussions have already occurred and are ongoing.
- Continues to conduct ongoing audits of Bridge Resource Management, navigational practice and the lashing system on Aratere and examination of cargo manifests of rail wagons carried, for compliance with the amended Cargo Securing Manual. Ongoing.
- Conducts ongoing audits of all Cook Strait ferries to ensure that trucks are lashed in accordance with the cargo lashing manual. Ongoing.
- Conducts ongoing audits to monitor the implementation of corrective actions proposed by Interislander. Ongoing.
- Reviews its procedures for promulgating safety information, including pertinent IMO circulars. Completed.
2. It is recommended that Interislander:
- Reviews and documents its procedures for downloading VDR information following an accident or incident and ensures that ships’ masters and officers have the knowledge and ability to do so. Completed.
- Ensures that helmspersons on its vessels are adequately trained and practised so that they can competently steer the vessel in all weather conditions. Completed.
- Conducts random, unannounced, command assessments of its masters and officers to check their knowledge of the equipment they use and its limitations, and knowledge of, and compliance with, company procedures. Ongoing.
- Formalises a policy that Masters and, if appropriate, officers and crew, are stood down from duty following a significant accident or incident for recovery, and to ensure their availability for internal and external investigations. Completed.
- Resolves confusion over optimum rudder angles, in particular the operating conditions applicable to high-lift rudders. Completed.
- In conjunction with its ships’ masters, review the use of stabilisers when running down weather in heavy weather conditions, and in particular when there is a risk that the vessel may be subject to surf riding. Completed.
- Require masters and deck officers to undergo initial training in heavy weather ship handling followed by regular refresher training. Completed.
- Extend the simulation modelling being carried out by naval architects into ship/tide/weather interactions in the Cook Strait, to include interaction between the ship and conditions likely to be experienced in the entrance channel to Wellington Harbour and the eastern entrance to Tory Channel in severe southerly weather. Completed.
- Provide MNZ with the results of any internal investigation and follow up action as a matter of course, rather than being required to do so. Ongoing.
ENDS
Weather Story ...Well here is the rain totals for Chicago from from July through August by Northern Illinois University... After a major event (we're still awaiting official word from the USGS and hydrologists on what type of event this was, IE, one in a 50 or 100 year flood, etc), people have been asking if that was a record rainfall we had last week.Rockford and Madison, WI have had their wettest Augusts ever, so how are we doing?
To answer that question, let's look at July and August 2007 up until today.
July 2007: 8.20" August 2007 (so far): 11.64"
July-August 2007 combined rainfall total: 19.84" The top 4 wettest Augusts ever:1. 14.23" -1987 2. 11.64" -2007 3. 11.17" -1900 4. 10.94" -1937
The top wettest July-August combined totals ever:20.14" -198719.84" -200717.58" -199616.77" -1900
We still have essentially 3 more days to go to add to the totals. There is a possibility that if we get .30" of rain Tuesday evening into Wednesday, we would tie the wettest July-August combined ever.
Finally, I had two brief periods to go out and take a few pictures of the flooding here on campus on Friday.
I took these around Barsema Hall, Gilbert Hall/Music building, Castle Drive, inbetween Faraday and Faraday West, and from my perch here on Davis Hall (the silly flash wouldn't shutoff on those pictures---sorry about that):http://weather.admin.niu.edu/floodof2007/But still, some good pix in there nonetheless.
Yes, that's an upset beaver in there on Castle Drive, annoyed that his dam is now somewhere on the Mississippi River. He walked right in front of me, but I didn't have my camera ready at that moment.
Also, Dr. Walker Ashley, a meteorology professor here at NIU, who had more time, got a considerably better variety and angle of shots:http://thetae.blogspot.com
Thanks to Dave Changnon for the help in acquiring the data, and to the 220,000 on and off-campus visitors *each day* between Wednesday and Friday of last week who used our site, setting a usage record in our nearly 9 year history!
USAID Assists Latin America and Caribbean After Hurricane Dean
August 22, 2007
Street Corner in Kingston, Jamaica one day after Hurricane Dean
Traffic light down in Kingston one day after Hurricane Dean
BACKGROUND AND KEY DEVELOPMENTS
On August 21, Hurricane Dean was downgraded from a category five to a category one hurricane on the Saffir- Simpson scale as it crossed Mexico’s Yucatan Peninsula and northern Belize. The storm continued across the Bay of Campeche on August 22, making landfall at 1230 hours eastern standard time near the town of Tecolutla, 40 miles south-southeast of Tuxpan, having strengthened slightly to a category two hurricane. According to the U.S. National Hurricane Center, Dean is expected to weaken as it moves inland.
Impact assessments are ongoing in Belize and Mexico, but early reports indicate less damage than originally expected.
Beginning on August 17, Hurricane Dean passed through the Eastern Caribbean as a category two storm, strengthening to category four as it moved across Jamaica. The hurricane caused damage in St. Lucia, Dominica, Jamaica, Haiti, Dominican Republic, and Martinique. The most damage reported to date is in Jamaica.
In response to the impact of Hurricane Dean in Jamaica, USAID/OFDA has dispatched relief commodities including 420 rolls of plastic sheeting, 6,250 blankets, 5,000 ten-liter water containers, and 2,592 hygiene kits. The commodities arrived in Kingston on August 22. The total value of all items, including transport, is more than $297,000.
On August 22, USAID/OFDA provided $100,000 to the Pan American Health Organization (PAHO) to respond to emergency health needs resulting from Hurricane Dean in Jamaica. To date, USAID/OFDA has provided more than $570,000 to support emergency response activities in Jamaica.
1 dead, 300 houses destroyed or partially destroyed, 1,600 persons in shelters
PAHO- August 21, 2007
Haiti
4 dead 2,000 families affected
OCHA2- August 19, 2007 IFRC3 – August 22, 2007
Jamaica
3 dead, 3,500 people in shelters 3,500 confirmed affected in areas assessed*
ODPEM4, August 21, 2007 USAID Assessment Team – August 21, 2007
Martinique
1 dead
OCHA- August 19
Saint Lucia
1 dead
OCHA- August 19
*Figures based on very preliminary figures. 1 Caribbean Disaster Emergency Response Agency (CDERA) 2 U.N. Office for the Coordination of Humanitarian Assistance (OCHA) 3 The International Federation of Red Cross and Red Crescent Societies (IFRC) 4 The Government of Jamaica’s Office of Disaster Preparedness and Emergency Management (ODPEM)
FY 2007 HUMANITARIAN FUNDING PROVIDED TO DATE
USAID/OFDA Assistance to Jamaica: $572,243 Total USAID Humanitarian Assistance to the Caribbean: $572,243
CURRENT SITUATION
Jamaica
On August 21, USAID disaster response specialists joined field assessments led by ODPEM to five severely affected communities. The teams reported extensive damage in the area of Old Harbour Bay in Saint Catherine Parish, where hurricane force winds demolished an estimated 80 percent of the houses and left thousands in need of relief assistance. These initial assessments also noted that Hurricane Dean killed three people, damaged thousands of houses, and left at least 3,500 people in need of food, water, and relief supplies. The USAID assessment team believes that the number of affected will continue to rise as results from other field assessments become available. Field assessments will continue on August 22.
According to ODPEM, although Hurricane Dean struck the island on August 19 as a category four hurricane, the storm did less damage to the island’s infrastructure than was initially anticipated. In contrast to previous hurricanes, such as the destructive Hurricane Ivan in 2004, Hurricane Dean moved quickly through Jamaica, resulting in less heavy rainfall and landslides.
Belize
According to USAID's disaster response specialist in Belize, Hurricane Dean destroyed more than 650 homes and displaced more than 1,600 people. However, the storm did not cause any major damage to infrastructure, and Belize’s international airport and seaports have reopened.
On August 21, U.S. Embassy staff conducted an aerial assessment utilizing two U.S. military helicopters, to determine the extent of hurricane damage in Belize. The overflight revealed some roof and crop damage, but overall was much less than initially expected.
Mexico
USAID emergency staff are conducting preliminary damage and needs assessments in the affected areas of Mexico, but reports to date indicate that because of excellent disaster preparedness planning and actions taken by the Government of Mexico (GOM), no one died in the Yucatan Peninsula as a result of Hurricane Dean and property damage was less than expected.
Cancun International Airport did not sustain significant damages during the hurricane, and the airport is on stand-by to receive flights carrying relief supplies in the event that the areas impacted by Hurricane Dean require assistance. To date, 85 percent of cellular communication is operating and public transportation and water services have resumed normal operations in Cancun, according to the Municipal Office of Public Works.
As of August 21, the Chetumal Airport remained closed, and public transportation has not resumed operations.
USG HUMANITARIAN ASSISTANCE
USAID/OFDA is monitoring Hurricane Dean’s track and impact from the Latin America and Caribbean (LAC) Regional Office in San Jose, Costa Rica, as well as from Washington, D.C. USAID/OFDA staff are currently in Barbados, Belize, Dominica, the Dominican Republic, Guatemala, Haiti, Honduras, Jamaica, Mexico, and Nicaragua. In total, 22 USAID/OFDA emergency staff are deployed to respond to the impact of Hurricane Dean.
Jamaica: On August 20, U.S. Ambassador to Jamaica Brenda LaGrange Johnson declared a disaster due to the damage caused by Hurricane Dean. In response to the impact of the hurricane, USAID/OFDA has dispatched relief commodities to Jamaica. The commodities, which include 420 rolls of plastic sheeting, 6,250 blankets, 5,000 ten-liter water containers, and 2,592 hygiene kits, are scheduled to arrive in Kingston on August 22. The total value of all items including transport is $297,243. USAID/OFDA has also provided $100,000 to support emergency health services through PAHO and $175,000 to ODPEM for emergency relief supplies. A six-member USAID assessment team, which arrived in Jamaica on August 18, continues to conduct assessments and coordinate response efforts with U.N. agencies, Government of Jamaica authorities, non-governmental organization (NGO) partners, donors, and other disaster assessment teams.
Mexico: On August 19, in advance of Hurricane Dean, USAID deployed three disaster response specialists to the Yucatan as well as a three-person team to Mexico City to work closely with the USAID mission, U.S. Embassy, and the GOM. The response specialists are currently conducting joint damage assessments with Mexican disaster responders. Two USAID emergency staff are traveling to areas around Vera Cruz to support assessments following Hurricane Dean’s second landfall. However, no U.S. assistance has been requested by the GOM.
Since 2000, USAID has provided more than $142 million in response to the devastating effects of hurricanes and tropical storms throughout Central America and the Caribbean.
Weather Story
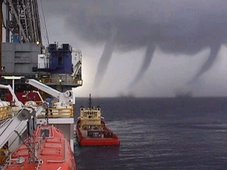
The Chicago storms of August 23 and 24th brought some very interesting and severe weather to the region. Here is one of the storm captured by Storm Chaser John Farley onAugust 24, 2007 in Madison County, Illinois
My name is Jay Cafasso and I am a retired hazardous mateials specialist and corporate executive. I am also a NWS advanced storm spotter. Robin Storm seeks to educate the public regarding severe weather as well as scientifically intercept and observe severe storm.
We chase safely to intercept and observe storms and report our observation to the local NWS/WFO so they can keep you better informed.
Remember, safety first always!
The purpose of this site is to educate the public on the topics of 'severe weather" and its effects on the "maritime service". Articles are drawn from a variety of sources both government and private and re posted in partial or full text. Article credit is linked or posted.
The information contained on this site is for educational purposes only and is not intended for any particular person and or circumstance nor for profit.
The author of this site makes no express warranties or guarantees.








![[full basin map of tropical cyclone activity]](https://lh3.googleusercontent.com/blogger_img_proxy/AEn0k_vfj7ee495gcCV67YGt733GTJUGK1vMxK8ohHSE0jEhe4BvKAklUkZglYPOGem3UrzebzUN8bzGtWcPT9w9YNy2LdgkI4j1XZXLTNqy8MbxnMTid3wy2-VKHOuoLmMov8dyk9uPEg5-ENgsOugGxSJz9KUrKRHyGp6E11o=s0-d)














![[Valid RSS]](valid-rss.png "Validate my RSS feed")