Friday, September 28, 2007

THE DEADLIEST, COSTLIEST, AND MOST INTENSE UNITED STATES TROPICAL CYCLONES

NOAA Technical Memorandum NWS TPC-5

THE DEADLIEST, COSTLIEST, AND MOST INTENSE UNITED STATES TROPICAL CYCLONES FROM 1851 TO 2006 (AND OTHER FREQUENTLY REQUESTED HURRICANE FACTS)


Updated 15 April 2007 for return period information Eric S. Blake Edward N. Rappaport Christopher W. Landsea NHC Miami National Weather Service National Hurricane Center Miami, Florida April 2007

PREFACE
This version of the Deadliest, Costliest, and Most Intense United States Tropical Cyclones extends the work of Blake et al. (2005) to include 2005 and 2006. New updates include revised hurricane landfall intensity data from the period 1851-1914, categorized inland hurricane impacts, new major hurricane statistics, an updated assessment of the impact from Helene (1958), and a new estimate of the deaths caused by Audrey in 1957. The technical memorandum also uses a revised methodology (Pielke et al. 2007) to produce an estimate of the monetary loss that historical hurricanes could exact on the current property-at-risk in the same location.

THE DEADLIEST, COSTLIEST, AND MOST INTENSE UNITED STATES TROPICAL CYCLONES FROM 1851 TO 2006 (AND OTHER FREQUENTLY REQUESTED HURRICANE FACTS) by Eric S. Blake, Edward N. Rappaport, and Christopher W. Landsea
NOAA/NWS/NCEP/TPC/National Hurricane Center Miami, Florida

ABSTRACT
This technical memorandum lists the deadliest tropical cyclones in the United States during 1851-2006 and the costliest tropical cyclones in the United States during 1900-2006. The compilation ranks damage, as expressed by monetary losses, in three ways: 1) contemporary estimates; 2) contemporary estimates adjusted by inflation to 2006 dollars; and 3) contemporary estimates adjusted for inflation and the growth of population and personal wealth (Pielke et al. 2007) to 2006 dollars. In addition, the most intense (i.e., major1 ) hurricanes to make landfall in the United States during the 156-year period are listed. Some additional statistics on United States hurricanes of this and previous centuries, and tropical cyclones in general, are also presented.

1. INTRODUCTION


The staff of the National Hurricane Center receives numerous requests for statistical information on deaths and damages incurred during tropical cyclones affecting the United States. Information about their intensity is also frequently of interest. Estimates of these measures vary in the literature. Our hope is to present the best compilation of currently available estimates. In some instances, data in our lists represent revised estimates based on more complete information received following earlier publications including previous versions of this technical memorandum.
There are other frequently asked questions about hurricanes, such as: What is the average number of hurricanes per year? Which year(s) had the most and least hurricanes? Which hurricane had the longest life? On what date did the earliest and latest hurricane occur? What was the most intense Atlantic hurricane? What was the largest number of hurricanes in existence on the same day? When was the last time a major hurricane or any hurricane impacted a given community? Answers to these and several other questions are provided in Section 3.

2. BACKGROUND AND DEFINITIONS


Many of the statistics in this publication depend directly on the criteria used in preparing another study, “Hurricane Experience Levels of Coastal County PopulationsTexas to Maine” [(Jarrell et al. 1992)]. The primary purpose of that study was to demonstrate, county by county, the low hurricane experience level of a large majority of the population. Statistics show that the largest loss of life and property occur in locations experiencing the core of a category 3 or stronger hurricane.
The Saffir/Simpson Hurricane Scale (SSHS, Table 1) provides wind, associated central pressure, and storm surge values.

There is not a one-to-one relationship between these elements and it is important to note that the original SSHS category assignment was based on a combination of these elements (Hebert and Taylor 1975). Since about 1990, however, the NHC has assigned the SSHS category by using the maximum one-minute wind speed value only. Thus there is an inconsistency in the HURDAT database (Jarvinen et al. 1984) that will be rectified as the Atlantic best-track reanalysis project is completed (Landsea et al. 2004b).

Currently, the SSHS category assignment is based on wind speed from 1851-1914 and 1990-2006 and on a combination of wind, pressure and storm surge from 1915-1989. Heavy rainfall associated with a hurricane is not one of the criteria for categorizing.
Dvorak satellite intensity estimates are often the only estimate of the wind. Available surface wind reports, surface estimates of wind from passive/active microwave satellites, aircraft reconnaissance flight-level winds (from which surface wind speed can be estimated), and dropsonde data occasionally supplement these wind estimates. In post-storm analysis, the central pressure ranges of hurricanes on the SSHS will usually agree fairly well with the wind ranges for each category. On the other hand, the storm surge is strongly dependent on the slope of the continental shelf (shoaling factor). This can change the height of the surge by a factor of two for a given central pressure and/or maximum wind.

The process of assigning a category number to a hurricane in any location is subjective, as is NHC’s estimate of a cyclone’s impact . It is made on a county-by-county basis. In this study, we use criteria for direct hit as described in the work by Jarrell et al. (1992). Note we are discontinuing the use of the term indirect hit because of the lack of local information that is conveyed in that language.
Direct Hit Using "R" as the radius of maximum winds in a hurricane (the distance in miles from the storm's center to the circle of maximum winds around the center), all or parts of coastal counties falling within approximately 2R to the right and R to the left of a storm's track were considered to have received a direct hit. (This assumes an observer at sea looking toward the shore. If there was no landfall, the closest point of approach was used in place of the landfall point). On average, this direct hit zone extended about 50 miles along the coastline (R≈15 miles).

Of course, some hurricanes were smaller than this and some, particularly at higher latitudes, were much larger. Cases were judged individually, and many borderline situations had to be resolved.
In this document, the term strike is designated to mean one of two things: During the years 1851-1914 and 1990 to 2006, a hurricane strike is defined as a hurricane that is estimated to have caused sustained hurricane-force winds on the coastline, but does not necessarily make landfall in the area of hurricane-force winds. One example of a hurricane strike is Hurricane Ophelia in 2005, which remained offshore of the North Carolina coast but still brought sustained hurricane-force winds to the coastline. During the years 1915 to 1989, a hurricane strike is defined as a hurricane whose center passes within the direct hit definition area provided above. The best-track reanalysis project is working to change the definition to be strictly defined by the winds, but for now the regional effects catalogued by HURDAT are in a transition period that could last several more years.

Statistics on tropical storm and hurricane activity in the North Atlantic Ocean (which includes the Gulf of Mexico and the Caribbean Sea) can be found in Neumann et al. (1999). A stratification of hurricanes by category which have affected coastal counties of the Gulf of Mexico and North Atlantic Ocean can be found in Jarrell et al. (1992) and also at the NOAA Coastal Services Center (http://hurricane.csc.noaa.gov/hurricanes/index.htm). Additional information about the impact of hurricanes can be found in annual hurricane season articles in Monthly Weather Review, Storm Data and Mariner’s Weather Log.
A new feature for this update is including the inland impacts of some hurricanes. These cyclones are indicated with an “I” before the state abbreviation in the HURDAT database and are exclusively used for hurricane impacts that are felt in a state, but not at the coastal areas. One example of this occurrence is Hurricane Dennis (2005). After landfall, Dennis produced category one hurricane winds over inland areas of Alabama, but these effects were not felt along the coast of Alabama. Thus an “I” is added in front of the state designation, to be IAL 1. If a hurricane primarily impacts the coastal areas of a state, inland effects are not listed separately. The goal of this listing is to indicate only the most significant impact of that state. Because of the geography of Florida, any effects in the state are considered coastal.

Read the rest of the report
THE DEADLIEST, COSTLIEST, AND MOST INTENSE UNITED STATES TROPICAL CYCLONES

Weather Story

USA. Scientists and beach managers to present at Lake Michigan, Great Lakes conferences in Traverse City

Experts will discuss Lake Michigan and Great Lakes beaches at concurrent conferences in Traverse City, Mich., Oct. 3 to 5. Scientists and beach managers will present the latest research on sustainability and environmental issues affecting the lake, Grand Traverse Bay and Great Lakes beaches.

Topics include the potential impact of climate change on Lake Michigan, economics of a healthy lake, fisheries, invasive species, recovering species, viral hemorrhagic septicemia, and health risks at beaches. The keynote speaker is John Austin, lead author of the recent Brookings Institution report "Healthy Waters, Strong Economy: the Benefits of Restoring the Great Lakes Ecosystem."
This is the fifth biennial State of Lake Michigan Conference and at each conference new information and reports have been presented about changes in the lake.
The conferences will be held at the Hagerty Conference Center, Northwestern Michigan College - Great Lakes Campus and the Holiday Inn - West, Traverse City.

Reporters are invited to attend any of the sessions. To request an interview with conference organizers or presenters, call Phillippa Cannon, EPA, or Mark Breederland, Michigan Sea Grant, at the numbers below.
The State of Lake Michigan and Great Lakes Beach conferences are sponsored by EPA Great Lakes National Program Office, the Lake Michigan Forum, Michigan Sea Grant College Program, the Great Lakes Beach Association and the Great Lakes Regional Research Information Network.

Tropical Weather Outlook

Atlantic/Caribbean/Gulf of Mexico:
Tropical Storm Lorenzo

At 4:00 am CDT, September 28, 2007, the government of Mexico has changed the Hurricane warning from Palma Sola to Cabo Rojo to a Tropical Storm Warning.

A Tropical Storm Warning is now in effect from Veracruz northward to Cabo Rojo. The Tropical Storm Watch from north of Cabo Rojo to La Cruz has been discontinued.

At 4:00 am CDT, September 28, 2007, the center of Tropical Storm Lorenzo was located about 30 miles south-southwest of Tuxpan, Mexico.

TS Lorenzo is moving toward the west near 7 mph. A motion toward the west-northwest is expected today, which will bring TS Lorenzo farther inland over east-central Mexico.

The center of TS Lorenzo made landfall at about 12:00 am CDT, September 28, 2007, about 40 miles south-southeast of Tuxpan, Mexico.

Maximum sustained winds are near 65 mph, with higher gusts. Rapid weakening is forecast today as TS Lorenzo proceeds inland, and this small system will likely become a Tropical Depression later today and dissipate by tonight or early tomorrow.

Tropical Storm force winds extend outward up to 45 miles from the center.

Estimated minimum central pressure is 995 mb (29.38 inches).

Storm surge flooding of two-to-four feet above normal tide levels, along with large and dangerous battering waves, is expected near and to the north of where the center has made landfall. Tide levels should return to near normal later today or tonight.

TS Lorenzo is expected to produce total rainfall accumulations of five-to-10 inches, with possible isolated maximum amounts of 15 inches over portions of east-central Mexico.

These rains could cause life-threatening flash floods and mud slides.

Elsewhere, tropical cyclone formation is not expected during the next 48 hours.

Tropical Storm Karen
At 5:00 am EDT, September 28, 2007, the center of Tropical Storm Karen was located about 755 miles east of the Windward Islands.

TS Karen is moving toward the west-northwest near 10 mph, and this motion is expected to continue for the next 24 hours.

Maximum sustained winds have decreased to near 45 mph, with higher gusts. Some additional weakening is possible during the next 24 hours due to strong upper-level winds.

Tropical storm force winds extend outward up to 150 miles, mainly to the east from the center.

The five day track projection keeps the center on a fairly straight northwesterly track, about 1,000 miles to the east of San Juan, PR and by Tuesday, October 2, 2007, approximately 1,000 miles east-southeast of Bermuda.

A tropical wave southwest of the Cape Verde islands is generating intermittent shower and thunderstorm activity. Development, if any, is expected to be slow to occur.

Elsewhere, tropical cyclone formation is not expected during the next 48 hours.

Eastern Pacific:
The area of low pressure located about 325 miles south-southwest of Manzanillo, Mexico, continues to show signs of organization.

Environmental conditions appear favorable for additional development, and this system could become a Tropical Depression within the next day or two as it moves toward the west-northwest.

Elsewhere...tropical cyclone formation is not expected during the next 48 hours.

Central Pacific:
Nothing to report.

Western Pacific:
The Joint Typhoon Warning Center (JTWC) has issued a Tropical Cyclone Formation Alert (TCFA) for the area of convection approximately 470 nm east of Manila, Philippines. Conditions will allow for convective development to increase. (NOAA, National Hurricane Center, Central Pacific Hurricane Center and the Joint Typhoon Warning Center)

African Situation

AFRICA (24 Sep.) A state of emergency was declared in the worst flood-affected areas as humanitarian workers tried to reach villages that have been cut off by water. Aid agencies have started appealing for funds to assist people hit by the floods in several African countries. UN agencies are seeking $43m for Uganda, where the government declared an emergency after 50 people died. The International Red Cross has sent relief experts to the continent to raise money and deal with emergencies in Ghana and Togo, as well as Uganda. 1.5m people are affected by the floods.

Maritime Notes:

Attached is the latest Notice to Mariners Published by the National Geospatial-Intelligence Agency. The notice transmitted is listed on the Maritime Safety Information (MSI) Website in the "Notice to Mariners" section as "Entire NtM". Graphics provided in this version are inadequate for navigation purposes. Navigation-quality chartlets are available for download on the MSI website as needed. Below is the link to the Notice to Mariners Web Page: http://www.nga.mil/maritime/

IMO – World Maritime Day

The IMO issued a news release in commemoration of World Maritime Day. The theme for this year’s event is IMO’s response to current environmental challenges. Secretary-General Mitropoulos pointed out that the maritime industry is a vital segment of the world economy and that the industry must do its part to protect the environment. (9/27/07).

Sinking of the ferry ESTONIA

On September 28, 1994, the ferry ESTONIA sank during a storm in the Baltic Sea. The sinking claimed 852 lives and the exact cause remains controversial. The ferry was engaged in an overnight crossing from Tallinn to Stockholm, carrying 989 passengers and crew. The official report states that the bow visor broke under the strain of the heavy weather, allowing large quantities of water to enter the car deck. The free-surface effect of the water on the open deck caused the ferry to list and rapidly sink. A variety of safety improvements were adopted subsequent to this incident.

RS

Thursday, September 27, 2007

The Ten Scariest Weather Scenarios

The Ten Scariest Weather Scenarios

Almost a month before Halloween is upon us again, so why not start a series of “world’s scariest” posts. Personally, things that scare me are things beyond my control. Take the weather, for example. Mother Nature can at once be both breathtaking beautiful and unspeakably terrifying (see tornado). Let’s run with the latter and examine the ten scariest weather scenarios…

10. The Northern Lights

Okay, so may be this is not a “weather event,” per se. But it’s an atmospheric phenomenon, so it’s close enough. It involves solar radiation and electrically charged particles and physics and what not. Contrary to popular belief, the lights can be seen throughout the United States depending on the conditions. One thing is for sure: If I walked out my door, glanced up at the sky and I saw what’s in that pic above, I would be seriously freaked out.

9. Ice storms

Little about winter weather is really that scary, but ice storms are the exception. Unpredictable, hard to forecast, devestatingly destructive, ice storms are among nature’s cruelest storms. The power company is never amused when one threatens. It has also led to the setting of, like, three Stephen King novels.

8. Raining animals

Some times, it literally rain’s cats and dogs. Well, fish at least. Some times, when especially power storms cross large bodies of water, updrafts and waterspouts can literally extract fish from the water, toss them into the atmosphere and rain them back down onto dry land. Again, if I walk out of my house and into a downpour of fish, I’m freakin’ out.

7. Derechos

From Wikipedia, a derecho is a widespread and long-lived, violent convectively induced windstorm that is associated with a fast-moving band of severe thunderstorms usually taking the form of a bow echo. Derechos are usually not associated with a cold front, but a stationary front within a highly buoyant, warm airmass. A warm weather phenomenon, derechos occur mostly in summer, especially July (in the northern hemisphere), but can occur at any time of the year and occur as frequently at night as in the daylight hours.

In other words, it’s a fast-moving, long-traveling, devastating wind that you can see coming at you on radar, but there’s nothing you can do about it. They produce widespread damage similar to that of tornadoes.

6. Gust fronts/Sand storms

These are lumped together because they look so similar. A gust front is a wall of clouds and ground debris preceding a severe thunderstorm. Also known as an outflow boundary, gust fronts can spawn weak tornado-like cyclones known as gustnados, which can cause significant damage. When a gust front, or sand storm for that matter (basically a wall of wind-driven sand) comes upon you, daylight can be totally obscured. It is easily one of the most eeriest sights in nature.

5. A supercell thunderstorm

A supercell is a singular, exceptionally powerful thunderstorm capable of producing vivid lightning, large hail, heavy rain and violent tornadoes. Supercells are characterized by exceptionally tall storm clouds, often exhibiting spirals or striations and form primarily in states where tornado activity is moderate to high.

4. Heat waves/drought

Heat waves and drought, lumped together because they so often happen in concert, are frightening since they are unpredictable year-to-year, season-to-season and because of their devastating short and long term effects. These two phenomenons can kill thousands immediately and destroy crop yields for decades, wiping out civilizations and causing everything from refugee crisis’ to civil wars (see, Darfur). Doesn’t help that Alabama has been through both this year, with the drought, unfortunately, continuing on.

4. Hurricanes/storm surge

These two events (the surge is a by-product of hurricane winds) make the largest storms on Earth some of the most frightening as well. Hurricanes are, in essence, complex thunderstorms, sometimes hundreds of miles wide, fed by warm ocean waters and producing widespread wind and water damage as well as spawning countless tornadoes. Hurricanes have plagued coastal regions for eons, most recently wiping parts of the U.S. Gulf Coast off the map with the landfall of Katrina in August 2005. The energy produced by the storms is equal to thousands of Hiroshima bombs and the fear that they have instilled within coastal residents is enough to spark mass evacuations, widespread hysteria, grocery store runs and hikes in insurance and gas prices. Storm surge is a phenomena caused when hurricane winds push a gigantic mound of water up and beyond the shoreline, flooding coastal areas with as much as 20 feet of seawater and effectively erasing miles of shoreline. After the initial flooding, waves on top of the rapidly rising waters batter buildings and roadways once hundreds of feet from the shoreline, reducing them to ruins.

2. Lightning/Ball Lightning

The most unpredictable and deadly weather phenomenon is lightning. It strikes with little to no warning, can single out people and buildings with randomness, affects every state in the U.S. regularly and causes hundreds of deaths each year. A bolt of lightning can travel at a speed of 100000 mph and can reach temperatures approaching 60000 °F, hot enough to fuse soil or sand into glass channels. There are over 16 million lightning storms every year.

As if that wasn’t scary enough, thousands of people have reported witnessing a phenomenon known as “ball lightning.” Here’s Wikipedia to explain: Ball Lightning refers to reports of a luminous object which varies in size from golf ball to several meters in diameter. It is sometimes associated with thunderstorms, but unlike lightning flashes arcing between two points, which last a small fraction of a second, ball lightning reportedly lasts many seconds. Ball lightning reportedly tends to rotate or spin and can possess odd trajectories such as veering off at an angle or rocking from side to side like a leaf falling. Fireballs can also move with or against the wind. Other motions include a tendency to float (or hover) in the air and take on a ball-like appearance. Its shape has been described as spherical, ovoid, teardrop, or rod-like with one dimension being much larger than the others. Many are red to yellow in colour, sometimes transparent, and some contain radial filaments or sparks. Other colours, such as blue or white occur as well. Pilots in World War II described an unusual phenomenon for which ball lightning has been suggested as an explanation. The pilots saw small balls of light “escorting” bombers, flying alongside their wingtips. Pilots of the time referred to the phenomenon as “foo fighters,” initially believing that the lights were from enemy planes. However there are other theories as to the identity of the foo fighters.

1. Tornadoes

Pretty easy call here: a menacing, roaring, dark column of wind rotating hundreds of miles an hour with the potential to debark trees, drive straw through tree trunks and skin animals alive. There is nothing about a tornado that isn’t scary, from the supercell thunderstorms that spawn them, to the sirens that wail upon their approach, to their serpent-like stature, to their incredible destructive power. Even better, they some times strike with little warning flying low enough below the clouds to escape detection on radar screens.

They have a penchant for spawning in the middle of the night when few people can hear the warnings. They tend to develop in mass, with some outbreaks totaling in the hundreds. They can move at highway speeds over great distances (the legendary Tri-State tornado) or they can sit over the same area for minutes on end (the legendary Jarrell, Texas tornado, which remained stationary for several minutes, ripping pavement off the ground, wiping homes clean off their foundations, and tearing the hide off of exposed livestock). They can be a few feet in diameter or up to two miles wide. Size, however, doesn’t determine strength, as some EF5 storms, the strongest of all, can be 40 feet wide or 400 yards wide.

RS


Wednesday, September 26, 2007

New technology helps Coast Guard pin point emergency signals


Office of Public Affairs
U.S. Coast Guard First District

BOSTON - Recent radio upgrades on a falcon jet at Air Station Cape Cod Mass., enable crews to rapidly locate the exact source of emergency signals, as seen during a recent search.

(Coast Guard Petty Officer 1st Class Michael O'Neal inspects the new 430 Direction Finding system aboard a Falcon jet at Air Station Cape Cod here Friday, Sept. 21, 2007. The new technology enables crews to rapidly locate the exact sources of emergency signals. U.S. Coast Guard photo.)

The HU-25 falcon jet equipped with the new gear launched Sept. 7 after the air station was notified of an Emergency Position Indicating Radio Beacon (EPIRB) emitting a distress signal from a boat near Jonesport, Maine. Coast Guard aircraft respond to EPIRB distress signals by following instrument guidance towards the radio beacon provided by direction finding equipment.

During the air station's first operational test of the new 430 Direction Finding (DF) system, the aircraft locked onto the EPIRB's signal from 72 miles away and obtained its location.

A 25-foot response boat from Station Jonesport determined that the boat was safely moored and the EPIRB was sending a false alarm.

"This new system saves us valuable response time, allowing us to receive more accurate guidance and acquire weaker signals," said Lt. j.g. Adam Young, a pilot at Air Station Cape Cod.

The HU-25 Falcon jet is one of only three aircraft in the Coast Guard with the new 430 DF system.

There are two types of EPIRB's, the original model that supplies only azimuth guidance and a newer device, a 406 EPIRB, that is registered to a specific user and can provide coordinates for the activated device's position.

When a boater's 406 EPIRB emits a distress signal, the beacon's position is transmitted via satellite to the U.S. Mission Control Center in Maryland where it is then passed to the appropriate rescue coordination center. The rescue coordination center in turn passes the position to the aircraft.

"The notification process usually only takes a few minutes, but those few minutes can be vital when factors such as cold water or injuries come into play," said Lt. Michael Nalli, a search and rescue coordinator at the First Coast Guard District.

With the new system, the Falcon not only obtains real-time data for a quicker response, it also obtains a more exact location.

The position the EPIRB passes to the satellite may be off by as much as three miles. But when the Falcon picks up the EPIRB's signal, it can usually pin-point the location.

"Mariners' widespread use of the 406 EPIRB has significantly reduced search time and unnecessary asset use," said Young. "Now if all mariners use a 406 EPIRB with the capabilities of the 430 DF system, we have the potential to take the search out of search and rescue."

Weather Story

Tropical Storm Karen and Jerry

MIAMI (AP) — Tropical Storm Karen strengthened from the twelfth tropical depression of the season early Tuesday in the open Atlantic Ocean but posed no immediate threat to land.

[full basin map of tropical cyclone activity] Tropical Storm Karen is about 1,355 miles east of the Windward Islands, and the 13th tropical depression of the hurricane season is about 165 miles east of Tampico, Mexico, the National Hurricane Center reported late Tuesday.

An area of cloudiness and a few thunderstorms is associated with a broad area of low pressure near the Virgin Islands in the Lesser Antilles, but the system is poorly organized and unlikely to develop, the NHC reported.

Another area of disturbed weather over South Florida, western Cuba and the western Bahamas is associated with a mid- to upper-level trough that could bring heavy rains to South Florida and the Florida Keys in the next several days, the NHC reported.

Additional information to expand on the West African flooding. . .

"Following torrential rains recorded in West Africa, floods have affected over 500,000 people in 12 countries: in Ghana (+270,000), Nigeria (50,000), Burkina Faso (+40,600), Togo (+100,000), Mali (25145), The Gambia (298), Niger (16,700), Senegal (3100), Côte d’Ivoire (2000), Liberia (17,000), Mauritania (30,000) and Sierra Leone (4500). Floods have caused the destruction of houses, food stocks, goods, farms and polluted most of the water sources (wells and canals). This has resulted in the displacement of thousands of people."

Maritime Notes

Long Beach – counter-terrorism exercise

The US Coast Guard issued a press release stating that members of the Los Angeles-Long Beach Area Maritime Security Committee will conduct a command post counter-terrorism exercise in Long Beach on September 27. (9/24/07).


RS


Tuesday, September 25, 2007

SURVIVAL AND TRAGEDY - ‘Fatal Forecast’

SURVIVAL AND TRAGEDY - ‘Fatal Forecast’ retells Georges Bank storm of 1980

By JODY FEINBERG
The Patriot Ledger

Twenty-seven years have passed since Plymouth lobsterman Gary Brown and three others died in a hurricane-force storm on the fishing grounds of Georges Bank. A fifth fisherman miraculously survived by hanging on to an inflatable raft for more than 50 hours.

The disaster and good fortune from that unforeseen November storm are dramatically told for the first time in the book ‘‘Fatal Forecast,’’ by Michael Tougias of Norfolk. Decades later, it’s both a riveting survival story and a cautionary tale.

‘‘I think it will go down as one of the top survival accomplishments ever recorded,’’ said Tougias, who was researching Coast Guard casualty reports for an earlier nautical thriller when he became fascinated with the survival of lobster man Ernie Hazzard of the Fair Wind.

A genuine page turner, ‘‘Fatal Forecast’’ vividly recreates the storm, the struggle and the survival. To convey what crew members and rescuers saw, thought and felt, Tougias extensively interviewed them. The book’s 14 photographs also bring alive the reality. One of the most incredible shows a small launch craft from a Coast Guard cutter heading toward Hazzard’s tiny life boat. Another shows the Coast Guard crew moving a blanket-covered Hazzard onto the boat.

‘‘It is both a miracle and a tribute to Ernie’s fortitude and decision making,’’ said Tougias, who has written 17 books and gives motivational presentations, including one inspired by Hazzard, titled ‘‘Survival Lessons.’’

‘‘I think his mind set and the techniques he used can help any of us who face difficult odds,’’ Tougias said.

As a former Marine, long-distance cyclist and mechanic, Hazzard drew upon all that he had learned from these experiences: Focus on the present, make the most of available resources, endure pain and discomfort, and accept loneliness.

When a monster 100-foot wave capsized the 50-foot Fair Wind and trapped the four-man crew inside, Hazzard, 33, survived by a mixture of luck and canniness. Seeing an exit, he dove underwater and through an opening into the sea, a risky move that would have been impossible if he’d been wearing a survival suit. His second bit of luck was finding a plastic bucket to cling to and then reaching an inflatable raft attached to the overturned boat. In the next two days as waves battered and toppled the raft, he survived by sheer mental determination, strength and practical know-how.

Like Hazzard, 30-year-old lobster man Gary Brown of Plymouth ended up in the ocean, when a giant wave blew out a side of the pilot house of the vessel, Sea Star. But Brown had no lifeboat to cling to and slipped away as his fellow crew threw him lifelines.

A memorial stone to Brown overlooks the ocean in front of the Lobster Pound on Manomet Point Road in Plymouth. Erected by his widow Honour Brown (who chose not to be interviewed for the book, but still lives in Plymouth with her second husband and children), the monument has a plaque inscribed with lines from the poem ‘‘Sea Fever’’ by John Masefield.

In the epilogue, Gary Brown is remembered by his captain Peter Brown (no relation). Brown also is the son of Bob Brown, owner of the Andrea Gail, whose tragic fate was the subject of ‘‘The Perfect Storm’’ by Sebastian Junger.

‘‘I never want to see a friend or crew member on my boat lost because of a bad forecast,’’ Brown reflected. ‘‘Gary Brown was a good man.’’

To Tougias, Hazzard also spoke about the long-term effects of the trauma on his life.

‘‘I don’t let little stuff get to me. And when bigger problems come along, I figure I’ll solve them somehow,’’ Hazzard said. ‘‘Although I don’t always make the best of these extra years, I am surely thankful for each and every day.’’

The cautionary story stems from the fact that the outcome might have been different if the fisherman had known about a broken wind sensor on the sole weather buoy on Georges Bank. Unaware of rising winds, they were surprised by hurricane speeds that brewed 60 foot waves, which grew to 90 to 100 feet.

A meteorologist in the Boston office of The National Weather Service had warned the National Oceanic and Atmospheric Administration (NOAA) of the danger of the broken sensor. Facing budget constraints, NOAA decided to put off repairs since a more sophisticated wind sensor was expected to be installed in January, Tougias wrote.

Whether the outcome would have been different even if the wind sensor had been working is something meteorologists debate, since the storm blew in so fast they called it ‘‘a bomb,’’ Tougias said.

‘‘I believe they were wrong not to alert listeners that their forecast did not have the benefit of the usual data from the weather buoy,’’ Tougias said. ‘‘But even if the wind sensor was working, it may have only reported what was actually happening at Georges Bank when the storm hit, and that would have been too late for the boats to turn back.’’

After the families learned about the buoy, Gary Brown’s wife, who was pregnant at the time of his death, and several other families sued and won $1.2 million in damages, the first time the National Weather Service was held responsible for an inaccurate forecast. However, the U.S. First Circuit Court of Appeals reversed the judgment in 1986, asserting that the government was protected from liability because weather forecasting is a ‘‘discretionary function.’’

‘‘I thought the judgment for the plaintiffs was the correct decision, and I did not agree with the appeals court over-turning it,’’ Tougias said. ‘‘However, the National Weather Service did make one important change as a result of the case, and that was in the future it would tell mariners when a weather buoy was not working.’’

Tougias will give a slide presentation on ‘‘Fatal Forecast’’ at 7:30 p.m. Nov. 12 at the Mansfield Historical Society, at 7 p.m. Nov. 15 at the Norwood Public Library and at 7 p.m. Dec. 6 at the Hull Lifesaving Museum. Admission is free. For more information, go to michaeltougias.com.

Copyright 2007 The Patriot Ledger
Transmitted Monday, September 24, 2007

Maritime Notes:

2008 Ocean Sciences Meeting

From the Watershed to the Global Ocean

2008 Ocean Sciences Meeting · 2-7 March 2-7 2008 · Orlando, Florida, USA

Co-sponsored by the American Society of Limnology and Oceanography, the American Geophysical Union, The Oceanography Society and the Estuarine Research Federation.

Key Dates

Submittal Deadline
2 October 2007

Author Notification
December 2007

Schedule Posted
January 2008

Registration Fees
Early: 1 February 2008
Regular: 1 March 2008
On-site: after 1 March 2008

Abstract Submittal Now Open

The abstract submission deadline is midnight (23:59 US, CDT) on Tuesday, 2 October 2007. In order for scheduling to be completed in a timely manner, all Internet and mailed submissions must be received by this date. An abstract submission fee of $50.00 USD is required for each submission, along with a full paid registration. This fee is non-refundable should it later be determined you are not able to attend and make your presentation. However, registration fees are refundable under the registration guidelines. Only one paper per first author will be accepted. Poster presentations are strongly encouraged and will play an important role in this meeting.

Be sure to read the abstract guidelines and registration policies before submitting.

Please click here to proceed to registration and abstract submittal.

Weather Disaster Reports - Africa

Floods in West Africa Minimize

Floods affect more than 500,000 people in West Africa

Following torrential rains recorded in West Africa, floods have affected over 500,000 people in 12 countries: in Ghana (+270,000), Nigeria (50,000), Burkina Faso (+40,600), Togo (+100,000), Mali (25145), The Gambia (298), Niger (16,700), Senegal (3100), Côte d’Ivoire (2000), Liberia (17,000), Mauritania (30,000) and Sierra Leone (4500). Floods have caused the destruction of houses, food stocks, goods, farms and polluted most of the water sources (wells and canals). This has resulted in the displacement of thousands of people.

Displaced populations are living either with host families or in public infrastructures such as schools and in IDPs camps . The school year scheduled to being in September in some of these countries may be delayed due to the occupation of schools by the displaced. In this lean season period, households already face problems to feed their own members and having to host victims of the floods may aggravate further their already precarious food security situation.

Access to affected population remains constrained by the poor condition of some roads (in Mauritania, Burkina Faso, Niger) and insecurity notably in Iferouane, northern Niger. The situation in Iferouane is of particular concern as humanitarian organisations continue to struggle to respond to the needs of some 500 persons affected by floods and food insecurity. In addition, reports of new landmines being laid around the city are also hindering humanitarian interventions. On 20 August landmines caused the death of four gendarmes in the region. In this regard there is an urgent need for relevant safety measures to be ensured by state and non-state actors to enable the safe provision of humanitarian assistance.

Health authorities and humanitarian actors remain concerned about the possible outbreak of waterborne diseases like cholera and the recrudescence of malaria cases.

These floods coincide with the most critical time of the year, the lean season when West African families mostly in the Sahel region face food insecurity. The destruction of crop and food stocks has aggravated the vulnerability of poor families and needs to be addressed promptly through emergency and recovery interventions.

Potable water is of concern because of the pollution of water sources and the existence of destroyed latrines that are considered to be the vector of possible epidemics.

20061054w.jpg


Floods in Ghana Minimize

Flooding in the Upper East Region, Upper West Region and Northern Region of Ghana has killed at least six people and affected over 276,000, according to the Government. They destroyed thousands of homes after torrential rains from 24 to 29 August. The flooding has also caused major bridges to collapse, and destroyed crops. Response-Government officials have visited the region to assess the damage and announced they would deliver initial relief supplies to affected populations. Regional authorities had appealed to the government, charitable organizations, religious bodies and NGOs for assistance. The United Nations are considering the deployment of an UNDAC team to Ghana.

Please find below some resources relative to the situation:

Ghana floods - Situation report n°2 - As of 17 September 07

Map of flood in Ghana - As of 18 September 07

Ghana - Humanitarian Contact list

Latest sitrep (12 September 07) in floods West Africa

Reference map of Ghana (UNCS)

Latest Map on floods in West Africa - As of 18 Sept. 07


Situation reports Minimize


Resource mobilisation Minimize


Maps Minimize

In this section you will find a range of maps that present information related to flood in West Africa.

Burkina Faso - Map of floods - As of 21 Sept. 07
Source : IRIN, Red Cross, IFRC
Date : 09 August 2007
Map made by: OCHA Dakar

West Africa- Map of floods in West Africa - As of 18 Sept. 07
Source : IRIN, Red Cross, IFRC
Date : 09 August 2007
Map made by: OCHA Dakar

West Africa- Map of floods in West Africa - As of 11 Sept. 07
Source : IRIN, Red Cross, IFRC
Date : 09 August 2007
Map made by: OCHA Dakar

West Africa- Map of floods in West Africa - As of 30 Aug. 07
Source : IRIN, Red Cross, IFRC
Date : 09 August 2007
Map made by: OCHA Dakar

West Africa- Map of floods in West Africa - As of 23 Aug. 07
Source : IRIN, Red Cross, IFRC
Date : 09 August 2007
Map made by: OCHA Dakar


WA_floods_23Aug_07.jpg


West Africa- Map of floods in West Africa - As of 22 Aug. 07
Source : IRIN, Red Cross, IFRC
Date : 09 August 2007
Map made by: OCHA Dakar


WA_floods_22Aug_07_thmb.jpg


Niger - Map of floods Niger - As of 22 Aug. 07
Source : OCHA Niger
Date : 09 August 2007
Map made by: OCHA Dakar


NER_floods_22Aug_07_thmb.jpg


West Africa- Map of floods in West Africa - As of 16 Aug. 07
Source : IRIN, Red Cross, IFRC
Date : 09 August 2007
Map made by: OCHA Dakar


WA_floods_17Aug_07_thmb.jpg

West Africa- Map of floods in West Africa - As of 8 Aug. 07
Source : IRIN, Red Cross, IFRC
Date : 09 August 2007
Map made by: OCHA Dakar

WA_floods_Aug_07.jpg
Mali - Carte de situation des inondations - A la date du 31 juillet 2007
Source : OCHA, MSF, Government
Date : April 2007
Map made by: OCHA Dakar

MALI_FloodsMap_August07.jpg
Map - Floods in Nigeria - As of 08 August 07
Source : IRIN, Red Cross
Date : April 2007
Map made by: OCHA Dakar

MAP_NGR_floods_Aug_07.jpg


Resources & Links Minimize


This website was developed with the assistance of Thematic Funding from the Humanitarian Aid Department of the European Commission in 2004 and 2005


RS

Monday, September 24, 2007

Ballard Live!

We talked about the Jason Project and what it offers school systems. Now here is an example from a school in Smithfield Rhode Island.

From the Providence Journal:

(Pix Left - Dr. Robert Ballard, live on the screen from the Mystic Aquarium, at upper right, speaks to teachers from around the state during a conference yesterday at Smithfield High School. Technical coordinator Michael Deslauriers is in the foreground.)

A group of science teachers and administrators from 10 public school districts in northern Rhode Island received a glimpse into the future of science education in Rhode Island and, perhaps, the nation yesterday.

Robert Ballard, discoverer of the Titanic and Bismarck wrecks, teleconferenced with the group, seated in the Smithfield High School library, from his office at the Institute for Marine Exploration at Mystic Aquarium, in Connecticut.

University of Rhode Island scientists under his supervision are excavating a sunken ship from the Byzantine era (about 1,500 years old) at the bottom of the Black Sea, near the Turkish shoreline, he explained.

Another television screen showed a live action feed from the Alliance, a NATO research vessel where the team is based.

“We’ll be getting into the stern of the ship in a day or so, where we hope we’ll see a greater diversity of artifacts, possibly even bodies,” Ballard told the rapt audience. Any human remains found in the oxygen-less waters at the bottom of the Black Sea are “likely to be perfectly preserved,” he said.

Smithfield High is the first high school in the world to be connected to the Inner Space Center at the University of Rhode Island, a place where university researchers monitor, track and share information about oceanography and archaeology in real time.

Half a year ago, Ballard, who created Inner Space, partnered with the Smithfield School Department to develop a control center that would enable students to interact directly with scientists engaged in ocean exploration anywhere on the planet, much as university-level researchers do.

The goal is to bring the technology into every science classroom in every school in the state.

“As the Ocean State, we have the opportunity to develop a unique curriculum, where we teach what we normally teach, and put an ocean take on it,” said Ballard. “This is an opportunity to be the tip of the spear.”

Considering yesterday’s setting was a public high school library, and not, say, a command center for NASA, the setup was impressive.

Three black, plasma televisions arrayed on a wall. Two high resolution computer monitors cycling a series of graphs, charts, and tables on a table below them. Behind hummed a massive black crate concealing a handful of networked computers, the brains of the operation.

Bridget Buxton, the project archeologist and an assistant professor at URI, explained from the Alliance live feed that the ship had been damaged in rough seas recently, and so a submersible could not be sent underwater to give the audience a glimpse of the wreckage.

Ballard, seated before a console identical to the one in the library, took questions from teachers, much as Smithfield students did in March, when his team was studying the Flower Garden Banks National Marine Sanctuary in the Gulf of Mexico.

This coming school year, Smithfield students will talk with Ballard’s team as they monitor changes in wildlife in Monterey Bay, Calif., another nationally designated underwater sanctuary.

Lauren Woods, an oceanography teacher at Woonsocket High School, liked that the program would allow students to interact regularly with scientists over the course of a year. She said her district has been incorporating video conferences in their curriculum for many years, but those opportunities are too few.

“It’s hard for kids to come up with questions on demand. This way, they can develop a relationship with the scientists so that there wouldn’t be any barrier to asking questions,” she said.

But the hardware that makes the innovative program work isn’t cheap.

Smithfield Supt. Robert O’Brien said the department would not have been able to afford the equipment, which included access to Internet2, the high speed network used by universities, had it not been on loan from URI.

“Cost is going to be the biggest hurdle,” observed Edward Saravo, a biology teacher at Johnston High School.

O’Brien said a more efficient system is in the works that will make the system more lightweight and portable. The school is also testing a larger version of the system in its 840-seat auditorium, where the entire high school can gather, if and when Ballard’s team makes a major discovery.

“It will become very affordable as the technology develops,” O’Brien said. “We’re at the very beginning of the future.”

Weather Story

Substropical Storm Jerry


http://www.ssd.noaa.gov/goes/flt/t1/avn.jpg

Subtropical storm Jerry, located far away from Florida in the north central Atlanta, is the 10th named storm of the 2007 hurricane season.

The National Hurricane Center announced Sunday morning that subtropical depression 11 had formed in the north central Atlantic. Before noon, the system had strengthened into a named storm. The NHC said the storm could acquire tropical characteristics later on Sunday.

Jerry poses no threat to the US mainland.

Maritime Notes

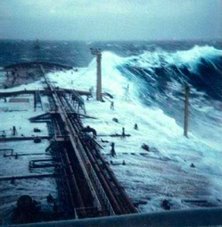
We talk about how severe weather like TS Jerry generates waves that effect ships at sea. Below is a video of ships listing and or taking large waves.


RS