 NOAA Technical Memorandum NWS TPC-5
 THE DEADLIEST, COSTLIEST, AND MOST INTENSE UNITED STATES TROPICAL CYCLONES FROM 1851 TO 2006 (AND OTHER FREQUENTLY REQUESTED HURRICANE FACTS)
Updated 15 April 2007 for return period information Eric S. Blake Edward N. Rappaport Christopher W. Landsea NHC Miami National Weather Service National Hurricane Center Miami, Florida April 2007
PREFACE This version of the Deadliest, Costliest, and Most Intense United States Tropical Cyclones extends the work of Blake et al. (2005) to include 2005 and 2006. New updates include revised hurricane landfall intensity data from the period 1851-1914, categorized inland hurricane impacts, new major hurricane statistics, an updated assessment of the impact from Helene (1958), and a new estimate of the deaths caused by Audrey in 1957. The technical memorandum also uses a revised methodology (Pielke et al. 2007) to produce an estimate of the monetary loss that historical hurricanes could exact on the current property-at-risk in the same location.
THE DEADLIEST, COSTLIEST, AND MOST INTENSE UNITED STATES TROPICAL CYCLONES FROM 1851 TO 2006 (AND OTHER FREQUENTLY REQUESTED HURRICANE FACTS) by Eric S. Blake, Edward N. Rappaport, and Christopher W. Landsea NOAA/NWS/NCEP/TPC/National Hurricane Center Miami, Florida
ABSTRACT This technical memorandum lists the deadliest tropical cyclones in the United States during 1851-2006 and the costliest tropical cyclones in the United States during 1900-2006. The compilation ranks damage, as expressed by monetary losses, in three ways: 1) contemporary estimates; 2) contemporary estimates adjusted by inflation to 2006 dollars; and 3) contemporary estimates adjusted for inflation and the growth of population and personal wealth (Pielke et al. 2007) to 2006 dollars. In addition, the most intense (i.e., major1 ) hurricanes to make landfall in the United States during the 156-year period are listed. Some additional statistics on United States hurricanes of this and previous centuries, and tropical cyclones in general, are also presented.
1. INTRODUCTION
The staff of the National Hurricane Center receives numerous requests for statistical information on deaths and damages incurred during tropical cyclones affecting the United States. Information about their intensity is also frequently of interest. Estimates of these measures vary in the literature. Our hope is to present the best compilation of currently available estimates. In some instances, data in our lists represent revised estimates based on more complete information received following earlier publications including previous versions of this technical memorandum. There are other frequently asked questions about hurricanes, such as: What is the average number of hurricanes per year? Which year(s) had the most and least hurricanes? Which hurricane had the longest life? On what date did the earliest and latest hurricane occur? What was the most intense Atlantic hurricane? What was the largest number of hurricanes in existence on the same day? When was the last time a major hurricane or any hurricane impacted a given community? Answers to these and several other questions are provided in Section 3.
2. BACKGROUND AND DEFINITIONS
Many of the statistics in this publication depend directly on the criteria used in preparing another study, “Hurricane Experience Levels of Coastal County PopulationsTexas to Maine” [(Jarrell et al. 1992)]. The primary purpose of that study was to demonstrate, county by county, the low hurricane experience level of a large majority of the population. Statistics show that the largest loss of life and property occur in locations experiencing the core of a category 3 or stronger hurricane. The Saffir/Simpson Hurricane Scale (SSHS, Table 1) provides wind, associated central pressure, and storm surge values.
There is not a one-to-one relationship between these elements and it is important to note that the original SSHS category assignment was based on a combination of these elements (Hebert and Taylor 1975). Since about 1990, however, the NHC has assigned the SSHS category by using the maximum one-minute wind speed value only. Thus there is an inconsistency in the HURDAT database (Jarvinen et al. 1984) that will be rectified as the Atlantic best-track reanalysis project is completed (Landsea et al. 2004b).
Currently, the SSHS category assignment is based on wind speed from 1851-1914 and 1990-2006 and on a combination of wind, pressure and storm surge from 1915-1989. Heavy rainfall associated with a hurricane is not one of the criteria for categorizing. Dvorak satellite intensity estimates are often the only estimate of the wind. Available surface wind reports, surface estimates of wind from passive/active microwave satellites, aircraft reconnaissance flight-level winds (from which surface wind speed can be estimated), and dropsonde data occasionally supplement these wind estimates. In post-storm analysis, the central pressure ranges of hurricanes on the SSHS will usually agree fairly well with the wind ranges for each category. On the other hand, the storm surge is strongly dependent on the slope of the continental shelf (shoaling factor). This can change the height of the surge by a factor of two for a given central pressure and/or maximum wind.
The process of assigning a category number to a hurricane in any location is subjective, as is NHC’s estimate of a cyclone’s impact . It is made on a county-by-county basis. In this study, we use criteria for direct hit as described in the work by Jarrell et al. (1992). Note we are discontinuing the use of the term indirect hit because of the lack of local information that is conveyed in that language. Direct Hit Using "R" as the radius of maximum winds in a hurricane (the distance in miles from the storm's center to the circle of maximum winds around the center), all or parts of coastal counties falling within approximately 2R to the right and R to the left of a storm's track were considered to have received a direct hit. (This assumes an observer at sea looking toward the shore. If there was no landfall, the closest point of approach was used in place of the landfall point). On average, this direct hit zone extended about 50 miles along the coastline (R≈15 miles).
Of course, some hurricanes were smaller than this and some, particularly at higher latitudes, were much larger. Cases were judged individually, and many borderline situations had to be resolved. In this document, the term strike is designated to mean one of two things: During the years 1851-1914 and 1990 to 2006, a hurricane strike is defined as a hurricane that is estimated to have caused sustained hurricane-force winds on the coastline, but does not necessarily make landfall in the area of hurricane-force winds. One example of a hurricane strike is Hurricane Ophelia in 2005, which remained offshore of the North Carolina coast but still brought sustained hurricane-force winds to the coastline. During the years 1915 to 1989, a hurricane strike is defined as a hurricane whose center passes within the direct hit definition area provided above. The best-track reanalysis project is working to change the definition to be strictly defined by the winds, but for now the regional effects catalogued by HURDAT are in a transition period that could last several more years.
Statistics on tropical storm and hurricane activity in the North Atlantic Ocean (which includes the Gulf of Mexico and the Caribbean Sea) can be found in Neumann et al. (1999). A stratification of hurricanes by category which have affected coastal counties of the Gulf of Mexico and North Atlantic Ocean can be found in Jarrell et al. (1992) and also at the NOAA Coastal Services Center (http://hurricane.csc.noaa.gov/hurricanes/index.htm). Additional information about the impact of hurricanes can be found in annual hurricane season articles in Monthly Weather Review, Storm Data and Mariner’s Weather Log. A new feature for this update is including the inland impacts of some hurricanes. These cyclones are indicated with an “I” before the state abbreviation in the HURDAT database and are exclusively used for hurricane impacts that are felt in a state, but not at the coastal areas. One example of this occurrence is Hurricane Dennis (2005). After landfall, Dennis produced category one hurricane winds over inland areas of Alabama, but these effects were not felt along the coast of Alabama. Thus an “I” is added in front of the state designation, to be IAL 1. If a hurricane primarily impacts the coastal areas of a state, inland effects are not listed separately. The goal of this listing is to indicate only the most significant impact of that state. Because of the geography of Florida, any effects in the state are considered coastal.
Read the rest of the report THE DEADLIEST, COSTLIEST, AND MOST INTENSE UNITED STATES TROPICAL CYCLONES
Weather Story
USA. Scientists and beach managers to present at Lake Michigan, Great Lakes conferences in Traverse City
Experts will discuss Lake Michigan and Great Lakes beaches at concurrent conferences in Traverse City, Mich., Oct. 3 to 5. Scientists and beach managers will present the latest research on sustainability and environmental issues affecting the lake, Grand Traverse Bay and Great Lakes beaches.
Topics include the potential impact of climate change on Lake Michigan, economics of a healthy lake, fisheries, invasive species, recovering species, viral hemorrhagic septicemia, and health risks at beaches. The keynote speaker is John Austin, lead author of the recent Brookings Institution report "Healthy Waters, Strong Economy: the Benefits of Restoring the Great Lakes Ecosystem." This is the fifth biennial State of Lake Michigan Conference and at each conference new information and reports have been presented about changes in the lake. The conferences will be held at the Hagerty Conference Center, Northwestern Michigan College - Great Lakes Campus and the Holiday Inn - West, Traverse City.
Reporters are invited to attend any of the sessions. To request an interview with conference organizers or presenters, call Phillippa Cannon, EPA, or Mark Breederland, Michigan Sea Grant, at the numbers below. The State of Lake Michigan and Great Lakes Beach conferences are sponsored by EPA Great Lakes National Program Office, the Lake Michigan Forum, Michigan Sea Grant College Program, the Great Lakes Beach Association and the Great Lakes Regional Research Information Network.
Tropical Weather Outlook
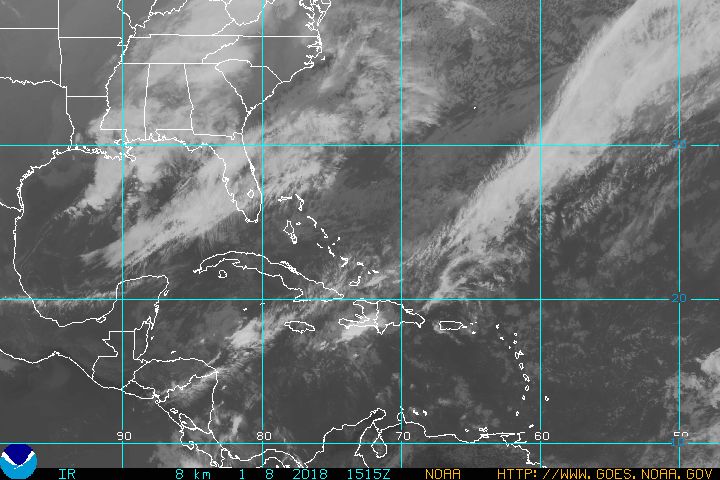
Atlantic/Caribbean/Gulf of Mexico:
Tropical Storm Lorenzo
At 4:00 am CDT, September 28, 2007, the government of Mexico has changed the Hurricane warning from Palma Sola to Cabo Rojo to a Tropical Storm Warning.
A Tropical Storm Warning is now in effect from Veracruz northward to Cabo Rojo. The Tropical Storm Watch from north of Cabo Rojo to La Cruz has been discontinued.
At 4:00 am CDT, September 28, 2007, the center of Tropical Storm Lorenzo was located about 30 miles south-southwest of Tuxpan, Mexico.
TS Lorenzo is moving toward the west near 7 mph. A motion toward the west-northwest is expected today, which will bring TS Lorenzo farther inland over east-central Mexico.
The center of TS Lorenzo made landfall at about 12:00 am CDT, September 28, 2007, about 40 miles south-southeast of Tuxpan, Mexico.
Maximum sustained winds are near 65 mph, with higher gusts. Rapid weakening is forecast today as TS Lorenzo proceeds inland, and this small system will likely become a Tropical Depression later today and dissipate by tonight or early tomorrow.
Tropical Storm force winds extend outward up to 45 miles from the center.
Estimated minimum central pressure is 995 mb (29.38 inches).
Storm surge flooding of two-to-four feet above normal tide levels, along with large and dangerous battering waves, is expected near and to the north of where the center has made landfall. Tide levels should return to near normal later today or tonight.
TS Lorenzo is expected to produce total rainfall accumulations of five-to-10 inches, with possible isolated maximum amounts of 15 inches over portions of east-central Mexico.
These rains could cause life-threatening flash floods and mud slides.
Elsewhere, tropical cyclone formation is not expected during the next 48 hours.
Tropical Storm Karen
At 5:00 am EDT, September 28, 2007, the center of Tropical Storm Karen was located about 755 miles east of the Windward Islands.
TS Karen is moving toward the west-northwest near 10 mph, and this motion is expected to continue for the next 24 hours.
Maximum sustained winds have decreased to near 45 mph, with higher gusts. Some additional weakening is possible during the next 24 hours due to strong upper-level winds.
Tropical storm force winds extend outward up to 150 miles, mainly to the east from the center.
The five day track projection keeps the center on a fairly straight northwesterly track, about 1,000 miles to the east of San Juan, PR and by Tuesday, October 2, 2007, approximately 1,000 miles east-southeast of Bermuda.
A tropical wave southwest of the Cape Verde islands is generating intermittent shower and thunderstorm activity. Development, if any, is expected to be slow to occur.
Elsewhere, tropical cyclone formation is not expected during the next 48 hours.
Eastern Pacific:
The area of low pressure located about 325 miles south-southwest of Manzanillo, Mexico, continues to show signs of organization.
Environmental conditions appear favorable for additional development, and this system could become a Tropical Depression within the next day or two as it moves toward the west-northwest.
Elsewhere...tropical cyclone formation is not expected during the next 48 hours.
Central Pacific:
Nothing to report.
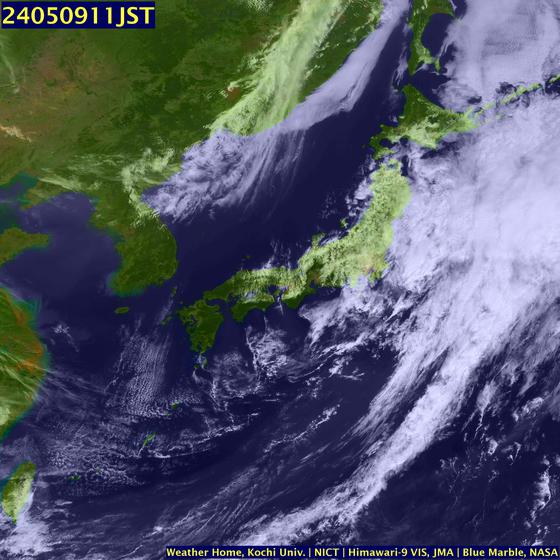
Western Pacific:
The Joint Typhoon Warning Center (JTWC) has issued a Tropical Cyclone Formation Alert (TCFA) for the area of convection approximately 470 nm east of Manila, Philippines. Conditions will allow for convective development to increase. (NOAA, National Hurricane Center, Central Pacific Hurricane Center and the Joint Typhoon Warning Center)
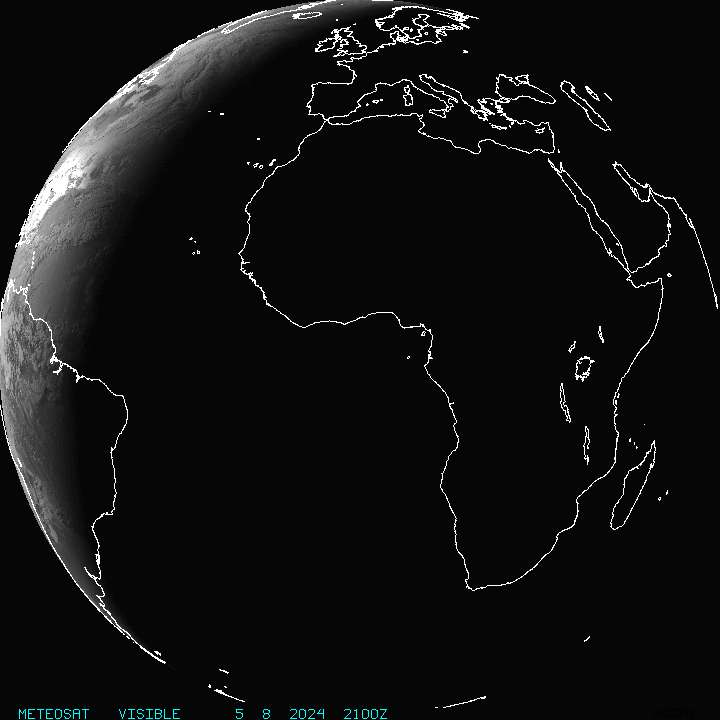
African Situation
AFRICA (24 Sep.) A state of emergency was declared in the worst flood-affected areas as humanitarian workers tried to reach villages that have been cut off by water. Aid agencies have started appealing for funds to assist people hit by the floods in several African countries. UN agencies are seeking $43m for Uganda, where the government declared an emergency after 50 people died. The International Red Cross has sent relief experts to the continent to raise money and deal with emergencies in Ghana and Togo, as well as Uganda. 1.5m people are affected by the floods.
Maritime Notes:
Attached is the latest Notice to Mariners Published by the National Geospatial-Intelligence Agency. The notice transmitted is listed on the Maritime Safety Information (MSI) Website in the "Notice to Mariners" section as "Entire NtM". Graphics provided in this version are inadequate for navigation purposes. Navigation-quality chartlets are available for download on the MSI website as needed. Below is the link to the Notice to Mariners Web Page: http://www.nga.mil/maritime/ IMO – World Maritime DayThe IMO issued a news release in commemoration of World Maritime Day. The theme for this year’s event is IMO’s response to current environmental challenges. Secretary-General Mitropoulos pointed out that the maritime industry is a vital segment of the world economy and that the industry must do its part to protect the environment. (9/27/07).
Sinking of the ferry ESTONIAOn September 28, 1994, the ferry ESTONIA sank during a storm in the Baltic Sea. The sinking claimed 852 lives and the exact cause remains controversial. The ferry was engaged in an overnight crossing from Tallinn to Stockholm, carrying 989 passengers and crew. The official report states that the bow visor broke under the strain of the heavy weather, allowing large quantities of water to enter the car deck. The free-surface effect of the water on the open deck caused the ferry to list and rapidly sink. A variety of safety improvements were adopted subsequent to this incident.
RS


![[Valid RSS]](valid-rss.png "Validate my RSS feed")
No comments:
Post a Comment