Monday, October 29, 2007

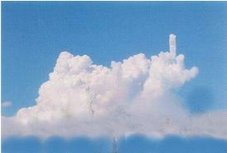
Large waves causes oil platform collision

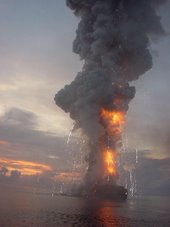
Here we have a tragic AP story that shows us the power of mother nature and its ocean waves.

In this incident
the Usumacinta, a mobile, self-raising drilling rig, was set up next to the Kab 101 a light production platform preparing to drill a well close to the platform.

The force of the waves caused of the rig's "legs" to hit the valve assembly of the platform.

Presently this incident is under investigation by the Mexican Government.


Mexico finds 2 more victims of oil rig collision; death toll 21
Friday, October 26, 2007

Rescuers found the bodies of two oil workers in the Gulf of Mexico on Friday, bring to 21 the death toll after a drilling rig and an offshore platform collided earlier this week.

Mexican state oil company Petroleos Mexicanos said in a statement that it would continue to look for the last two missing workers. Most of the victims drowned after they abandoned the rig and their life rafts were swamped by high seas. Some 63 workers have been rescued, some after treading water for hours.

A total of 81 workers and five rescue personnel abandoned the subcontractor's drilling rig known as the Usumacinta on Tuesday, after it hit the Kab 101 light-production platform and damaged a valve.

Pemex said a team had reached the damaged platform Friday and would begin installing an emergency valve to inject fluid that would control a leaking underwater valve. Fumes from leaking gas and continued rough weather were making it hard to perform the repairs, however.

Pemex director Jesus Reyes Heroles said there would be an investigation of the wreck 20 miles (32 kilometers) off the coast of Tabasco state, during stormy weather that generated 80 mph (130 kph) winds and 25-foot (8-meter) waves.

Aerial photos of the damaged platform released by the Mexican government showed thin ribbons of black and brownish oil snaking across the Gulf waters around the structure. Pemex has said most of the leakage is gas, not oil.

The office of the attorney general for environmental protection said the leakage amounted to about 500 barrels of oil.

Pemex was also struggling with another spill, in the Jaltepec and Coatzacoalcos coastal rivers, where an estimated 10,000 barrels of oil products leaked from a land pipeline after a crack appeared on Wednesday.

Ranulfo Marquez, the assistant secretary of civil defense for the Gulf coast state of Veracruz, said containment booms were set up to try to stop the slick from flowing downstream. [end]

Here is another story from the Herald Times

And off the coast of North Korea...

N.Korean cargo ship capsizes, 22 missing-Xinhua
Sun Oct 28, 2007 11:38am EDT

BEIJING, Oct 28 (Reuters) - Twenty-two people are missing after a cargo ship registered in North Korea capsized in the Yellow Sea about four miles off China's eastern Shandong province on Sunday, Xinhua news agency reported.

An official with the provincial maritime bureau said strong winds were sweeping the area when the accident happened and only three of the 25 crew members had been saved, Xinhua said.
Local fishermen and police officers were organizing rescue efforts, the official said. It was not clear what cargo the ship was carrying.

RS


Friday, October 26, 2007

Seiches

I ran across a very interesting article about a Seiche that hit Chicago on June 26, 1954, killing 8 on the beachhead.

So what is a Seiche? Well according to the USGS....

Seismic Seiches are standing waves set up on rivers, reservoirs, ponds, and lakes when seismic waves from an earthquake pass through the area. They are in direct contrast toThe term seismic seiche was first coined by Anders Kvale in 1955 to describe oscillation of lake levels in Norway and England caused by the Assam earthquake of August, 1950. But this was not the first time that seismic seiches had been observed. The first published mention was after the great earthquake of November 1755 at Lisbon, Portugal. An article in Scot's Magazine in 1755 described seiches in Scotland in Loch Lomond, Loch Long, Loch Katrine and Loch Ness. They were also seen in English harbors and ponds and were originally described in the Proceedings of the Royal Society in 1755.

Earthquake effects recorded by surface-water gages were first noticed by A.M. Piper of the U.S. Geological Survey (USGS). He reported that two of six gauges on the Mokelumne River in California showed a slight fluctuation caused by the December 20, 1932 earthquake at Lodi, California. Since then many seiches resulting from earthquakes have been recorded. Kvale made a detailed study of 29 seiches recorded in fiords and lakes in Norway and four seiches on reservoirs in England, all caused by the 1950 Assam earthquake. Frank Stermitz, a USGS scientist, reported readings from 54 stream gages that recorded seiches caused by the Hebgen Lake, Montana, earthquake of 17 August 1959. These were in Montana, Wyoming, Idaho, and Alberta, Canada - the most distant seiche being 545 kilometers from the epicenter.

Seismic waves from the Alaska earthquake of 28 March, 1964, were so powerful that they caused water bodies to oscillate at many places in North America. Seiches were recorded at hundreds of surface-water gaging stations - although they had rarely been reported following previous earthquakes. Indeed, four seiches were observed in Australia.

Some of the 1964 seiches were very large. Waves as high as 1.8 meters were reported on the Gulf Coast - probably because they were generated in resonance with the seismic surface waves.

Arthur McGarr and Robert C. Vorhis studied the continental distribution of seiches produced by the Alaska earthquake. They divided the seiches into two groups - those that occurred in Alaska itself and those that occurred outside the State.

The Alaska seiches were not wholly seismic, but were caused by landslides, submarine slides, tsunamis, and tilting - as well as by seismic surface waves. It was therefore difficult to isolate a particular mechanism for seiches produced within the epicentral region. At teleseismic distances (greater than 1000 kilometers) from the epicenter, inelastic effects are unimportant and seiches are generated solely by seismic surface waves.

After the 1964 Alaska earthquake, the southeastern part of the United States had by far the greatest density of seiches. Other high density areas included north and central New Mexico, eastern Kansas, and the region at the southern tip of Lake Michigan. The areas west of the Rockies, the Middle Atlantic States and New England experienced few or no seiches.

The 1964 distribution does not have any obvious dependence on distance or azimuth from the epicenter. But it does seem to have definite regional patterns, which reflect the influence of major geologic features:

  • The density of seiches is roughly proportional to the thickness of surface sediments, for example, in the Mississippi Delta region.
  • Thrust faults apparently provide a favorable environment for seiche generation. The relationship is especially clear in Georgia, near the Brevard thrust zone, in the Ouachita Mountains, and also in the Valley and Ridge province of Tennessee and Alabama.
  • Seiche locations were also controlled by structural uplifts and basins - such as the Williston and Michigan basins.

Abridged from Earthquake Information Bulletin, January-February 1976, Volume 8, Number 1.

See also: Seismic seiches from the March 1964 Alaska earthquake


Dockside Consultants has another brief on Seiches ...

Seiching

Following one of Southern California’s earthquakes, I noted that some of the water had splashed out of a neighbor’s swimming pool. When I inquired as to how this had happened, he described a series of waves created during the earthquake. This phenomenon is known as seiching and can occur when any external force disturbs an enclosed body of water. Waves move back and forth from one end to the other. The period of the waves depends on the size (length and depth) of the body of water. (See Appendix 1 for typical calculations.) In this sense they can also be described as standing waves. Seiches can be caused in bays and harbors by tidal currents, by the arrival of a distant swell with just the right period, or by storms or a tsunami. Sometimes these will oscillate for days.[37] Seiches are generally not a problem and are detectable only by means of careful measurements. However, in the case of harbor designs, one usually studies the predominant wave periods in the area and ensures that the harbor dimensions do not create a condition where large seiches can occur, since this could cause excessive movement of floating docks and straining of vessel mooring lines.

Hurricane Katrina (August 29, 2005) caused an 8 meter (26 foot) storm surge. This raised the level of Lake Pontchartrain enough to damage the levees and flood New Orleans. It also caused a rotating seich that lasted for several days.[38]

On a large scale, seiches have proved dangerous, damaging boats at dock, and occasionally killing people fishing near shores or on breakwaters. Such an incident occurred on June 26, 1954, when a 3 meter (10 foot) high wave suddenly rolled in from Lake Michigan and swept eight fishermen off of a breakwater, drowning them.[39]

A seich requires some exciting force. On the Great Lakes, seiches are caused by fast moving thunderstorms or squall lines that move eastward across the lake. The combination of the wind blowing toward a low pressure area enables a wave to form. In deep water, the wave is not very high. With the right wind speed and direction, the squall line can move as fast as the wave front, literally pushing it ahead. As the wave approaches shallow water near the shore, its height increases, governed by the same physics as any other wave. After hitting the Michigan side of the lake, the wave is reflected back toward the Illinois side. This is where its insidious nature becomes evident. If the originating storm was fairly short-lived, the chances are that the lake has returned to normal on the Illinois side; boaters and others may have resumed their activities in the aftermath of the storm. Suddenly, out of nowhere, a wave can appear and disrupt the scene. In 35 years, there have been five major seiches that have caused damage along the Chicago lakefront. During the summer of 1988 there were three noteworthy seiches along the Chicago lakeshore. These were not as bad as the one in 1954, but some damage resulted. They caused the water level to rise or fall by as much as 0.3 to 1.2 meters (1 to 4 feet), in some cases with the change occurring in less than 10 minutes. Boats can drop and hit bottom, or if dock lines are snug, the lines can break or rip cleats out of the boat or off the dock.

And from the University of Wisconsin ...
What is a seiche? (pronounced "saysh")

Like water sloshing in a bathtub, seiches are tide-like rises and drops in Great Lakes coastal water levels caused by prolonged strong winds that push water toward one side of the lake, causing the water level to rise on the downwind side of the lake and to drop on the upwind side. When the wind stops, the water sloshes back and forth, with the nearshore water level rising and falling in decreasingly small amounts on both sides of the lake until it reaches equilibrium.

Are Seiches common?

According to Deane Wassink who went ahead a did some research into the phenomena. They are not that common, but the phenomena is also recent..

On April 7, 1893 a gale pushed a seich of four to five feet high into the port of Chicago causing serious damage to many boats. At the same time in St. Joseph, Michigan it pushed inland seven hundred feet past the normal high water mark on the shore.

On June 26, 1954 a ten foot high seiche slammed into Chicago sweeping seven people off a dock to their deaths.

An especially interesting story occurred in Muskegon, Michigan. On May 30, 1998 a giant thunderstorm known as a "derecho" ( pronounced "deret-cho") tore across the Great Lakes causing tremendous damage with its tornado strength straight line winds. A tugboat crew saw the storm approaching and headed into the Muskegon harbor for safety. They felt the seiche pick them up and go past them. When the front of the storm passed the crew turned the boat around to head out of the harbor. The returning slosh of the seiche as it was focused by the narrow channel was so high and violent that it overturned the tugboat! Thankfully, the crew was rescued without serious injury or loss of life.

Just a fasinating phenomena..


RS

Thursday, October 25, 2007

Weather History - Furure Storms

Click to enlarge Click to enlarge A massive collapse of Cumbre Vieja in the Canary Islands would cause a tsunami to radiate all the way across the Atlantic Ocean to the East Coast. PHOTOGRAPH BY J. SCHWAKE/ALAMY
Cumbre Vieja, the most active volcano in the Canary Islands, lurches as a violent earthquake wracks its upper slopes. A third of the mountain breaks away and plunges into the Atlantic Ocean, pushing up a dome of water nearly 3000 ft. high. They don't yet know it, but tens of millions of Americans from Key West, Fla., to South Lubec, Maine, have just 9 hours to escape with their lives.
Click to enlarge Click to enlarge The tsunami's probable trajectory within 5 hours of the collapse of Cumbre Vieja.

The collapse of Cumbre Vieja unleashes a train of enormous waves traveling at jetliner speed. The first slam into nearby islands, then the African mainland. By the time they reach the East Coast of North America, the waves are up to 80 ft. high, and in low-lying areas, sweep several miles inland.

When tsunamis strike the United States, it is usually Hawaii or Alaska that take the hit. But topography and population density put the East Coast

Click to enlarge Click to enlarge The tsunami's potential range of destruction 9 hours after the collapse of Cumbre Vieja.
in a special risk category. “More Easterners are exposed to potential tsunamis--from the Canary Islands or the Cape Verde Islands--than the people on the West Coast, which has a steep coastline and few lowlands,” says Steven Ward, a geophysicist at the University of California, Santa Cruz. A Cumbre Vieja eruption in 1949 opened a mile-long, 20-ft.-deep fissure near the crest, forcing the volcano's western face to slump several feet. A 1971 eruption didn't budge it.

Marine geologists at Southampton Oceanography Center in Great Britain have a different take. They conclude the volcano would collapse in stages--

at worst threatening nearby islands. Ward calculates only a 5 percent chance Cumbre Vieja will trigger a tsunami in a given century, but that when it does a chunk of earth 15 miles long, 9 miles wide and nearly 1 mile thick will plunge into the sea--a landslide 250 times larger than the collapse of Mount St. Helens.


Coast Guard: Dangerous Rescues - Preview


RS

Wednesday, October 24, 2007

Tropical Cyclone Report - Tropical Storm Ingrid

Tropical Cyclone Report Tropical

Storm Ingrid
(AL082007) 12 – 17 September 2007

Michelle Mainelli

National Hurricane Center
17 October 2007

Ingrid was a tropical storm that formed over the central tropical Atlantic Ocean and dissipated as it approached the Leeward Islands.


Synoptic History


Ingrid developed from a large tropical wave that exited the coast of Africa on 6 September. At that time, strong easterly shear inhibited development over the eastern Atlantic and it was not until 9 September that a broad area of low pressure developed along the wave axis, about midway between Africa and the Lesser Antilles. The easterly shear gradually diminished over the next several days, which allowed the system to maintain convection near the low center on 11 September, when Dvorak classifications were initiated. By the morning of 12 September, the system acquired sufficient organization to be designated a tropical depression, while centered about 980 n mi east of the Lesser Antilles.


The “best track” chart of the tropical cyclone’s path is given in Fig. 1, with the wind and pressure histories shown in Figs. 2 and 3, respectively. The best track positions and intensities are listed in Table 1. The depression moved on a general west-northwestward track within a weak steering flow south of a mid-tropospheric ridge. Despite moderate westerly shear, the cyclone became a tropical storm around 0600 UTC 13 September, while centered about 730 n mi east of the Lesser Antilles, and reached its maximum intensity of 40 kts 12 h later. Persistent westerly shear, due to a stronger than normal upper-trophospheric mid-oceanic trough located west-northwest of the cyclone, prevented further intensification. During the next 24 hours, the shear increased, which resulted in Ingrid weakening to a tropical depression by 1800 UTC 15 September. Ingrid remained a tropical depression for a day or so before degenerating into a remnant low around 0600 UTC 17 September, while centered about 140 n mi east-northeast of Antigua. The remnants of Ingrid moved slowly northwestward and west-northwestward within the lower-tropospheric steering flow, and the low dissipated on 18 September.


Meteorological Statistics


Observations in Ingrid (Figs. 2 and 3) include satellite-based Dvorak technique intensity estimates from the Tropical Analysis and Forecast Branch (TAFB) and the Satellite Analysis Branch (SAB), as well as flight-level and Stepped Frequency Microwave Radiometer (SFMR) surface observations from several flights of the NOAA P-3 research aircraft. Microwave satellite imagery from NOAA polar-orbiting satellites, the NASA Tropical Rainfall Measuring Mission (TRMM), the NASA Aqua, the NASA QuikSCAT, the Department of Defense WindSat, and Defense Meteorological Satellite Program (DMSP) satellites were also useful in tracking Ingrid.


The estimated peak intensity of Ingrid on 14 September represents a blend of the surface-adjusted flight-level winds and SFMR data from the NOAA P-3 aircraft. During the morning flight on 14 September, the SFMR reported a maximum 51 knot wind over the southwestern quadrant of the storm; however, this observation did not appear representative of the strength of the poorly-defined circulation. The minimum pressure of 1002 mb is based on a dropsonde pressure of 1004 mb that was accompanied by a 26-kt surface wind, which indicates that the dropsonde probably did not sample the center of the cyclone and its lowest pressure.


No ship or land station reported sustained winds of at least tropical storm force in association with Ingrid.


Casualty and Damage Statistics


There were no reports of damage or casualties associated with Ingrid.


Forecast and Warning Critique


The genesis of Ingrid was well anticipated. The tropical wave that eventually spawned Ingrid was first introduced into the Tropical Weather Outlook (TWO) at 0230 UTC 7 September, about five days prior to genesis. At that time, the wave was located a few hundred miles south of the Cape Verde Islands. For the next couple of days, there was continual mention in the TWO that slow development of the system was possible. By late on 9 September, the potential for tropical depression formation was explicitly mentioned in the outlook. It was not until early on 12 September that the system acquired enough organization to be designated as a tropical depression. This resulted in a 54-hour lead time between the first mention of potential tropical depression formation in the TWO and when tropical cyclogenesis actually occurred.


A verification of NHC official and guidance model track forecasts is given in Table 2. Average official track errors for Ingrid were 28, 52, 89, 115, 145, and 154 n mi for the 12, 24, 36, 48, 72, and 96 h forecasts, respectively. These errors are lower than or close to the average long-term official track errors for all forecast periods (Table 2). Both the GFSI and UKMI models performed relatively well in comparison to the other dynamical model guidance. Notably, the UKMI had lower track errors than the official forecasts at all forecast lead times except for 24 h. Both the GFSI and UKMI kept a more westerly track compared to the other dynamical models during the first couple of days. The GFSI and UKMI maintained Ingrid as a weak system and anticipated the ridge to the north of the cyclone to remain intact. On the other hand, the NGPI had the largest errors as it forecasted a stronger Ingrid to take a more northwestward track in response to a weakness in the subtropical ridge. Despite somewhat of a dichotomy in the model guidance, the official track forecasts correctly maintained Ingrid on a more westward track within the low- to mid-level steering flow.


Average NHC official intensity errors were 2, 4, 4, 8, 18, and 28 kt for the 12, 24, 36, 48, 72, and 96 h forecasts, respectively (Table 3). For comparison, the average long-term official intensity errors are 6, 10, 12, 14, 18, and 20 kt, respectively. The official intensity forecast errors were slightly below the average long-term errors through 72 hours; however, they were larger than the average error at 96 h. Even though only three official forecasts verified at 96 h, the larger than average errors at that forecast time can be attributed to the global models predicting that the shear would lessen, which would allow for gradual strengthening of the cyclone. The GHMI provided the most accurate intensity guidance and did particularly well in the later forecast periods. It is notable that the GFDL Hurricane Model correctly predicted the weakening, in this case, in the sheared environment. In earlier years that model was notorious for over-intensifying tropical cyclones in environments of strong vertical shear. This change could be attributable to recent improvements in the GFDL model physics.

Read the rest of the report here: Tropical Storm Ingrid –
PDF – MSWord

More on the October 18, 2007 Heartland Storms -

October 18, 2007 Greenville to Neoga, IL Chase

by John Farley

The setup:

An unusually strong - below 29.00 inches surface low over Minnesota - storm system was moving through the Midwest. The system was negatively tilted, with extremely strong mid and upper level winds from the southwest over surface winds that would range from SSW in western IL to southerly in eastern IL ahead of a cold front/dryline that would push across Illinois late in the day. At first it looked like the system would move through too fast for daytime storms in IL, but by the night before, it began to look like the timing would be better. Read the rest October 18, 2007 Greenville to Neoga, IL Chase

RS

Monday, October 22, 2007

Damage Reports Extreme Weather, October 18, 2007

The National Weather Service confirmed Saturday October 20, 2007 that it was in fact a tornado, not straight line winds, that hit the New Washington area Thursday night October 18, 2007 when storms rolled through the area.

The weather service’s staff surveyed northern Clark County both Friday and Saturday and classified the tornado as low EF-3 on the Enhanced Fujita scale, indicating that winds were between 136 and 165 miles per hour. The storm took roofs off of a few houses and tree damage was widely reported. By Saturday, the weather service was still investigating other possible tornados in the region. So far, six tornados have been confirmed in Indiana and Kentucky with the storm outbreak. Clark County’s was the strongest in the region.

Louisville Kentucky NWS
confirmed tornadoes from October 18, 2007

(Click the links below for detailed information on each tornado event)

Click Here for Details on the Enhanced Fujita (EF) Tornado Rating Scale

Breckinridge County, Kentucky:

Clark County, Indiana: EF-3

Northern Bullitt County, KY (2 Miles North of Shepherdsville)

Hancock County Kentucky & Perry County Indiana

Meade County, Kentucky

Jefferson County, KY (Louisville Metro Area)

Marion County, Kentucky


Paducah, Kentucky NWS reports -

Two rounds of severe weather occurred on Thursday

The first round of severe weather occurred during the early morning hours on Thursday, mainly between midnight and 5 A.M. Wind damage was quite common across parts of southern Illinois and southeast Missouri overnight. The primary corridor of wind damage extended from the Poplar Bluff area northeast across Benton Illinois. Most of the damage was tree damage. Some minor structural damage and windows blown out were reported. A preliminary summary of local storm reports follows at the end of this statement.

A second severe weather outbreak occurred during the afternoon and evening hours on Thursday. The Paducah National Weather Service office issued over 130 warnings during the 24 hours ending at 10 P.M. Thursday. Numerous supercells occurred on Thursday afternoon and evening. A number of these supercells were associated with damage. The National Weather Service office in Paducah is conducting ground surveys today to obtain a better assessment of the type and extent of the damage that occurred Thursday afternoon and evening.

Grand Rapids Michigan NWS confirms EF2 in Williamston

Williamston tornado rated EF-2
AN NWS SURVEY WAS CONDUCTED IN INGHAM COUNTY FOLLOWING THE TORNADO
THAT OCCURRED ON THE NIGHT OF OCTOBER 18TH. BASED ON EXTENSIVE
DAMAGE TO BUILDINGS AND TREES THE TORNADO WAS RATED EF-2 WITH TOP
WINDS ESTIMATED BETWEEN 120 AND 130 MPH.


FEMA Situation Report
Tornado Activity

Missouri

A line of severe storms moved across Missouri Wednesday afternoon and evening causing heavy rains, damaging winds and tornadoes. According to the Missouri Emergency Management Agency (EMA), in Monroe County two people were killed when high winds struck a mobile home six miles northeast of Paris, MO. The National Weather Service confirmed an F2 tornado in Paris. The Missouri EMA has received no requests for assistance.

Florida

On Thursday, October 18, 2007, several Tornados touched down in downtown Pensacola, FL. According to local media sources, the storm ripped roofs off buildings, snapped trees and downed power lines. Florida Emergency Operations have confirmed in Escambia County, FL that four houses have been destroyed, 24 houses received major damage, 58 houses received minor damage, and 2700 customers in Escambia County are without power. There are no reports of injuries. A shelter was opened at 2:00 p.m. CDT, coordinated by the American Red Cross (ARC). ARC reported that eight people are being sheltered at this time. Food will be provided for up to 1,000 people. The storms caused forecasters to issue several severe weather warnings, including more tornado warnings. The severe weather was expected to clear out of the area Friday. (Florida Emergency Operations Center, Media Sources)

Storm Chaser Dan Robinson of Storm Highway has a excellent photo record of the October 18, 2007 Fall tornado outbreak in Kentucky/Indiana.


Wall Cloud Owensboro, Kentucky


And of Course Rain and Hail in Chicago!


RS

Friday, October 19, 2007

Freak Waves and Tornado's

My good friend and rogue wave expert Dr. Paul C. Liu has a very interesting story of a freak wave incident that happened in the Mediterranean Sea.

Its a sad story that I helped research for Paul. Its a reminder to all of us that the sea can be just as deadly no matter if your on a ship/boat or on the beach or rocky ledge.

We then head to my legal beagle friend Dennis Bryant for the latest legal news,
COGSA peril of the sea interpreted

In an unpublished opinion, the US Court of Appeals for the Fifth Circuit ruled that an unforeseeable severe storm constituted a peril of the sea within the meaning of the Carriage of Goods at Sea Act (COGSA). In the instant case, plaintiff cargo owner had sued the shipowner for damage to the cargo while on board defendant’s ship. The evidence showed that the ship had experienced Beaufort 10-12 winds and seas for a full day and that the storm had not been predicted. Corus UK Ltd v. Waterman Steamship Co., No. 06-30205 (5th Cir., October 18, 2007).

Latest Notice to Mariners
http://www.nga.mil/maritime/

Lastly, the plains yesterday experienced some more severe weather. From Oklahoma to Illinois to Kentucky to Michigan where we have reports of a tornado killing one person In Kalkaska County, Michigan.

Here are some clips...

Madisonville, Kentucky


Twister in P'Cola


Haunting weather sounds!


RS

Thursday, October 18, 2007

The S/V Sean Seamour III - The Green Boat


Well my good friend Jean Pierre deLutz the Master of the S/V Sean Seamour II, which ran into trouble and sank during Subtropical Storm Andrea has built another sailer. Can't seem to keep a good sail boat captain down for long.

We are still investigating the EPIRB malfunction.

By the way Jean, where did you put the "pitch pole roll-bar?" :-)

As Jean writes;

The Green Boat adventure

"After the loss of our Sean Seamour II between Cape Hatteras and Bermuda on May 7th 2007 see (Final Log), I was in quandary to define what Sean Seamour III should be.

My wife Mayke had long insisted that we should have a silent boat (no diesel engine to smell or hear) and a catamaran for it offers a stable platform. I had long insisted that we would never have a boat that could not right itself from a 180°. After May 7th, a Catamaran was longer a debate, but silent clean propulsion remained both her desire and my curiosity.

Living on the Mediterranean where wind is either overly abundant or non existent (sailing to Corsica is often motoring there), we opted for a Nauticat 33 motorsailor. A stable platform with a deep keel, decent sailing performance with its extended ketch rig, foremost, a great platform to experiment its transformation into a diesel-electric hybrid as a first step before, we hope a fuel cell electric drive. Through this blog we would like to share our ideas, trials and tribulations, as well as create an interactive repository of knowledge and references on the state of the art and where it may be going. Please don't hesitate to share and contribute, we are all breaking ground.

In the months ahead we will be looking at all the facets of going green. This means breaking down the technology blocks constitutive of a green system, looking at who and what is present and or emerging. We will study the performance and suitability for our project. We are also keeping a sharp eye on new technologies in related areas in an effort to see when and if technology migration, or perhaps we should use the term crossover, may come to benefit green boat adventures where ever they may be.

We hope players from all horizons will come and join our adventure, manufacturers and inventors, system integrators and installers, yards, craftsmen and mariners like us."

Note

We have been advise that the USCG Rescue crew will be decorated for this rescue shortly. The USCG story is posted here, Summary of Action for CG6014 for the S/V SEAN SEAMOUR II- REDUX - Plus, just an amazing rescue story.

I think we can all say congratulations to USCG LCDR Nevada Smith and his crew for a job very well done.

Weather Story UPDATE

A line of sereve thunderstorms crossed southern Illinois around 3 AM. The line delivered winds recorded up to 65 to 70 MPHs and up to 3 inches of rain. NOAA’s Storm Prediction Center reports about a dozen twisters had been reported by late Wednesday evening among the more than 138 reports of severe weather. Missouri State Highway Patrol reports two people are dead after a tornado tore apart a mobile home in rural Monroe County.

The threat of tornado's and even micro-bursts extends into today, Thursday, October 18, 2007.

In other Weather News from
Arthur Rabjohn;
:
GREECE: Wet weather warning sent
Authorities from around the country have been placed on alert for possible floods, particularly in the parts of southern and central Greece hit by devastating fires over the summer, with wet weather expected to start as of Friday. The National Meteorological Service (EMY) informed fire authorities and the Secretariat for Civil Protection about the deteriorating weather conditions. “From Friday afternoon until the middle of next week, we are expecting heavy rainfall across all of Greece,” said the head of EMY, Dimitris Ziakopoulos. Despite the low rainfall in the first half of October, firefighters were called to handle 42 calls of flooding across Greece, mainly in the Attica area. Fire authorities said all regional heads have been called to map out local possible danger points for flash floods in their district and to set up teams that will be on 24-hour standby.

INDONESIA: Fears of an imminent eruption prompted the evacuation of thousands of residents near Indonesia's Mount Kelud on Wednesday, but many flouted the order stayed at their homes around the Javanese volcano. The alert on the volcano, one of Indonesia's deadliest and located 90 km southwest of its second-largest city, Surabaya, was raised to maximum late on Tuesday, meaning it could erupt within 24 hours. Source: Reuters AlertNet

BANGLADESH: A powerful storm swept through southern Bangladesh killing at least 18 people in mudslides and house collapses and injuring 100, officials said on Tuesday. At least 20 fishing boats sank in the Bay of Bengal and at least 50 of their crew were still missing, fishing community leaders said. Source: Alertnet

RUSSIA: Volcano Bezymianny in Russia is erupting with SWVRC alert level 2. The GDACS alert level is Green.

SOUTH PACIFIC: A magnitude 6.4 earthquake hit deep under the South Pacific seabed between Fiji and New Zealand Wednesday. There were no reports of injury or damage.

USA: A magnitude 4.2 earthquake hit California's San Bernardino County early Tuesday, sending shudders across the region, authorities said.


RS

Robin Storm previous s/v Sean Seamour II posts:

Summary of Action for CG6014 for the S/V SEAN SEAMOUR II- REDUX - Plus
WebExclusive EPIRBs and the s/v Sean Seamour II - Part III

WebExclusive EPIRBs and the s/v Sean Seamour II - Part II
EPIRBs and the s/v Sean Seamour II
NHC Report on Subtropical Storm Andrea
Cheating Death On The High Seas
The s/v Sean Seamour II & The Hatteras Trench
High Sea's Update On Sean Seamour II
The Story of the Sailing Vessel Sean Seamour II

gCaptain previous s/v Sean Seamour II posts:
gCaptain Exclusive - Sailing in Severe Weather
Lessons Learned

Wednesday, October 17, 2007

Dangerous Weather Situation Developing

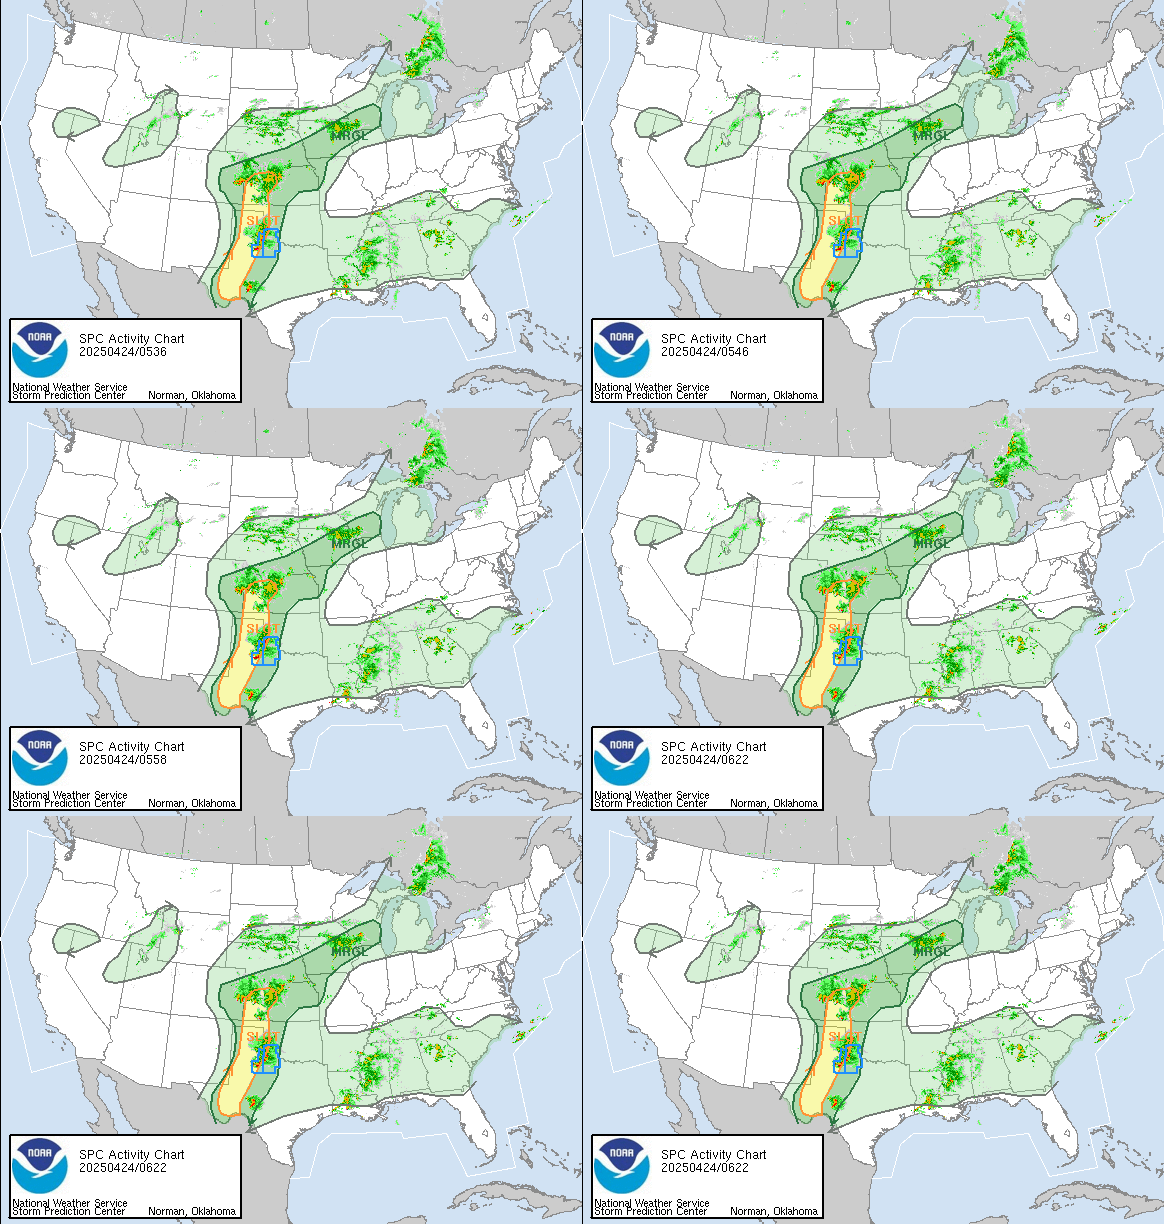
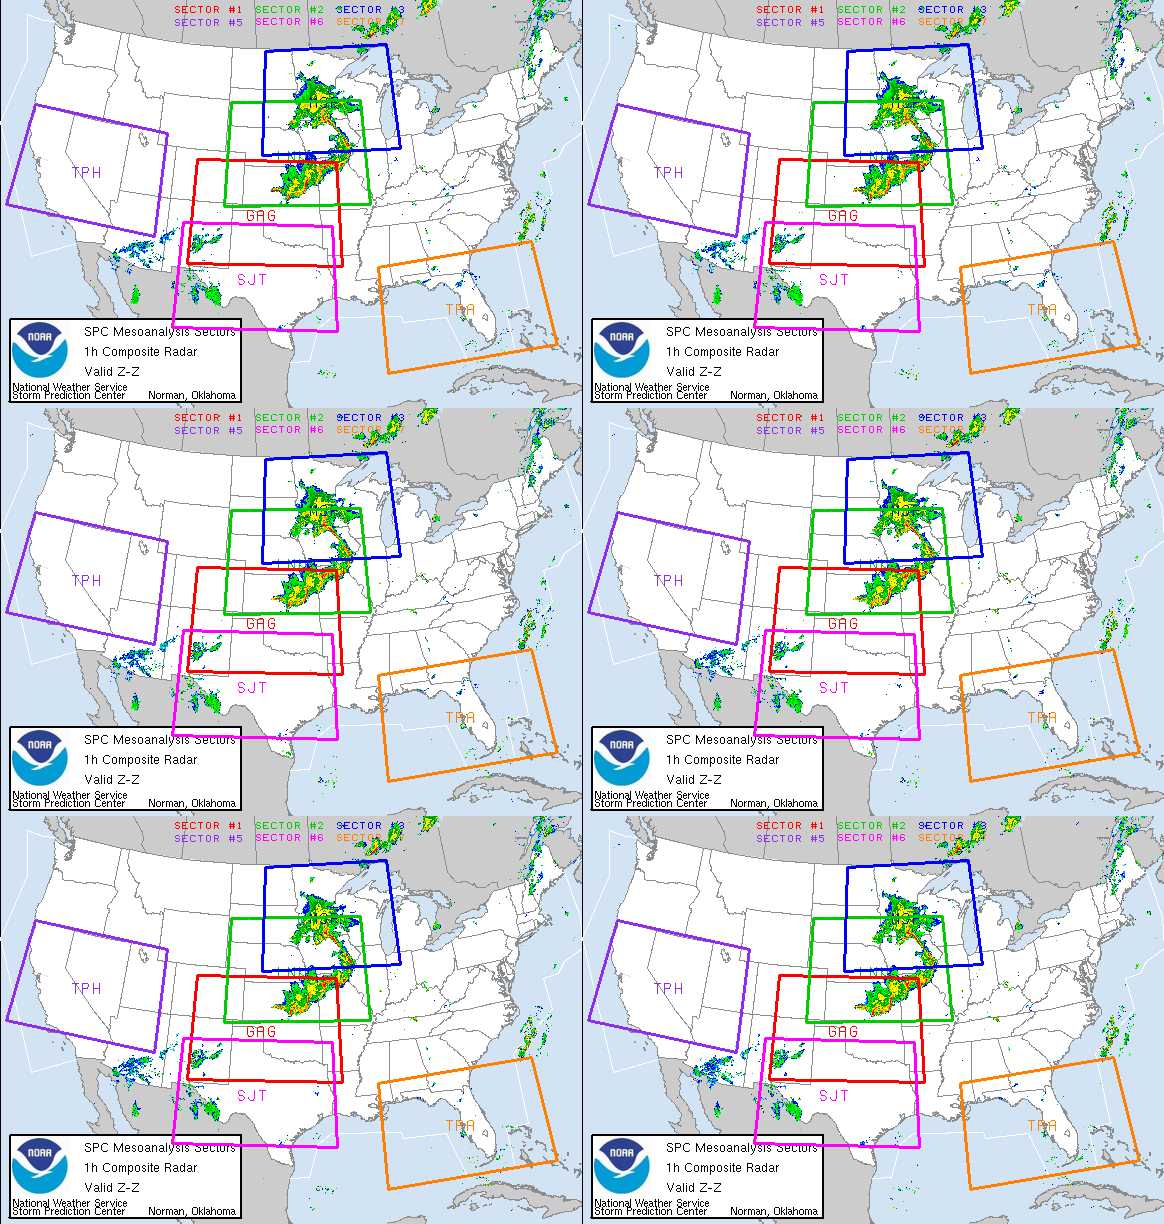
Widespread severe weather is likely through tonight from the southern Plains to Missouri, southern Iowa, Illinois and Western Kentucky as a deepening storm tracks through western Kansas and a powerful jet stream moves overhead.

The strongest thunderstorms will be capable of producing damaging winds, large hail and torrential downpours.

A twisting motion in the atmosphere, which is caused by southeast winds at the surface and southwest winds overhead, can spawn widespread tornado outbreaks. Residents on the Plains should monitor local media outlets, weather radios for updates on the severe weather.

Here is the latest from NWS Paducah KY -

HAZARDOUS WEATHER OUTLOOK
NATIONAL WEATHER SERVICE ST LOUIS MO
603 PM CDT WED OCT 17 2007

ILZ058>060-064-065-069-070-074-079-095>102-MOZ018-019-026-027-
034>036-041-042-047>052-059>065-072>075-084-085-099-181215-
GREENE IL-MACOUPIN IL-MONTGOMERY IL-BOND IL-FAYETTE IL-CLINTON IL-
MARION IL-WASHINGTON IL-RANDOLPH IL-ADAMS IL-BROWN IL-PIKE IL-
CALHOUN IL-JERSEY IL-MADISON IL-ST. CLAIR IL-MONROE IL-KNOX-LEWIS-
SHELBY-MARION-MONROE-RALLS-PIKE-BOONE-AUDRAIN-MONITEAU-COLE-OSAGE-
CALLAWAY-MONTGOMERY-LINCOLN-GASCONADE-WARREN-ST. CHARLES-FRANKLIN-
ST. LOUIS-ST. LOUIS CITY-JEFFERSON-CRAWFORD-WASHINGTON-
ST. FRANCOIS-STE. GENEVIEVE-IRON-MADISON-REYNOLDS-
603 PM CDT WED OCT 17 2007

THIS HAZARDOUS WEATHER OUTLOOK IS FOR PORTIONS OF EASTERN AND
CENTRAL MISSOURI AS WELL AS WEST CENTRAL AND SOUTHWEST ILLINOIS.

.DAY ONE...TONIGHT
OCCASIONAL THUNDERSTORMS ARE EXPECTED ACROSS THE AREA TONIGHT...A
FEW OF WHICH WILL BE SEVERE. THESE SEVERE STORMS WILL BE CAPABLE OF
PRODUCING TORNADOES...GOLF BALL SIZE HAIL AND DAMAGING WIND GUSTS
TO 70 MPH. THE RISK OF SEVERE WEATHER INCLUDING ISOLATED TORNADOES
WILL CONTINUE THROUGH THE NIGHT.

INFORMATION ON CONVECTIVE WATCHES...PLEASE REFER TO THE STORM
PREDICTION CENTER WEBPAGE AT (ALL LOWERCASE)...
HTTP://WWW.SPC.NOAA.GOV/PRODUCTS/WATCH.

.DAYS TWO THROUGH SEVEN...THURSDAY THROUGH TUESDAY

THERE IS A SLIGHT RISK OF SEVERE THUNDERSTORMS TO THE EAST OF THE
MISSISSIPPI RIVER ON THURSDAY.

SOUTHWEST WINDS WILL GUST TO 30 TO 40 MPH ON THURSDAY.

THERE IS ANOTHER CHANCE OF THUNDERSTORMS FROM SUNDAY NIGHT
THROUGH MONDAY NIGHT.

.SPOTTER INFORMATION STATEMENT...

SPOTTER ACTIVATION IS LIKELY FOR TONIGHT.

&&

FOR A GRAPHICAL VERSION OF THIS INFORMATION SEE OUR
WEBPAGE AT (LOWERCASE)... HTTP://WWW.WEATHER.GOV/LSX/?N=HWO1

$$

BRITT

NWS Weather Radio


Last map update: Wed, Oct. 17, 2007 at 6:18:55 pm CDT
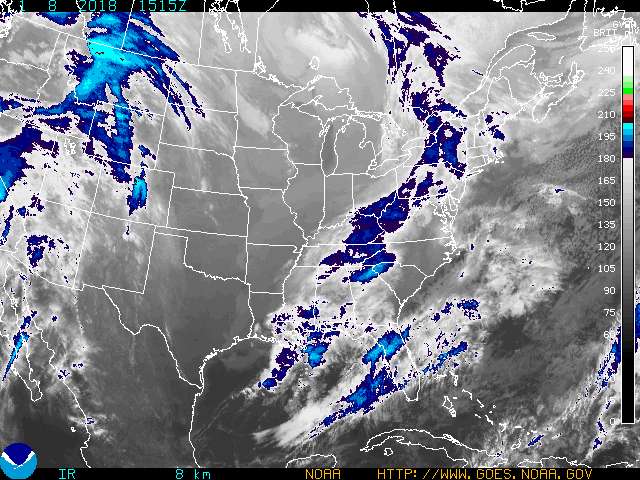
SATELLITE IMAGERY

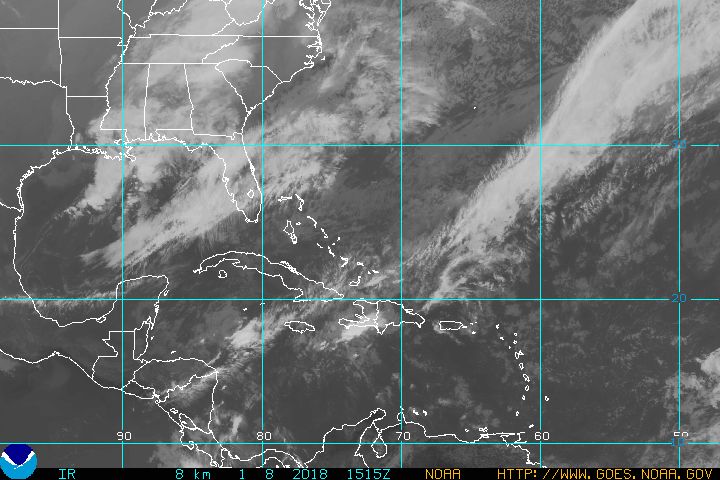
Infrared satellite image of U.S.


RS

EC unveils new EU maritime policy

EC unveils new EU maritime policy
12 October 2007

The European Commission has adopted an Integrated Maritime Policy for the European Union, which has the world’s largest maritime territory, marking the first time in its 50 years that it will have a strategic approach to decision-making in Maritime Affairs. The policy was unveiled at a press conference on 10 October in Brussels, Belgium.

European Commissioner in charge of Fisheries and Maritime Affairs Joe Borg said: "This is a crucial first step for Europe's oceans and sea – unlocking the potential and facing the challenges of a Maritime Europe will be our common goal. It will allow us to make the most of the geopolitical realities of our continent and will help Europe face some of the major challenges before it.

"At the European level, it is clear the transnational character of maritime affairs demands a European approach: shipping and traffic corridors cross the waters of our Member States, oil spills and pollution know no borders in Europe's waters and illegal activities … are transnational by nature, affecting all of Europe."

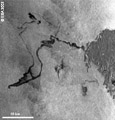
oil spill

Prestige oil spill
The European Commission (EC) said the new policy will build on Europe's strengths in marine research, technology and innovation and will be anchored in the European Union's (EU) overarching commitment to ensuring that economic development does not come at the price of environmental sustainability.

Under the European Space Policy, ESA is responsible for implementing space capabilities that respond to EU policy needs. The Integrated Maritime Policy will facilitate efficient exploitation of space systems in the maritime sector, which ESA has been actively involved in over the last 25 years.


ESA’s ERS satellites have been the main vehicles for testing and demonstrating the feasibility of using satellite Earth Observation (EO) data in different maritime policy areas. The ERS missions supported developments in oil slick detection, sea ice monitoring, wind and wave forecasting, regional ocean current forecasting, coastal bathymetry mapping and vessel detection.

Because both ERS-1 and ERS-2 significantly exceeded their original design lifetime of three years, it was possible to build an extended, continuous and homogeneous time series of oceanographic measurements, which were not previously possible.


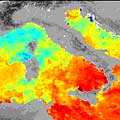
SST map
Sea surface temperature map

In particular, accurate measurements of sea surface height variation by the radar altimeter instrument provided a unique capability to monitor variations in currents at the regional level while the Along Track Scanning Radiometer (AATSR) series of instruments have delivered a highly accurate time series of sea surface temperature variations over a 16-year period.

In addition, satellite data from the radar altimeters onboard ESA’s ERS-1, ERS-2 and Envisat and NASA/CNES’ Topex-Poseidon detected a trend in sea level rise between 2.64 and 3.29 mm/year over the last 15 years.

In 2002, the newly launched Envisat acquired images of the Prestige oil spill in Spain with its Advanced Synthetic Aperture Radar (ASAR) instrument. Since this time, ESA has been working within the Global Monitoring for Environment and Security (GMES) Services Element to demonstrate and qualify the capacity for pan-European oil spill surveillance. Last year, an operational satellite-based oil slick detection service based on SAR data from Envisat and the Canadian Radarsat satellite was set up for all European waters under the European Maritime Safety Agency (EMSA). The service, named CleanSeaNet, is the first operational pan-European satellite based surveillance service for European waters.


CleanSeaNet service

CleanSeaNet service
Under this service, a notification of a pollution event can be provided within 20 to 30 minutes of the satellite overpass. By integrating the SAR oil slick information with vessel information, it becomes possible to identify potentially responsible vessels.

"This is a first, and significant, step in the process whereby EMSA assists Member States and the Commission in detecting illegal and accidental discharges at sea," Willem de Ruiter, Executive Director of EMSA said.

Intentional and accidental discharges threaten fragile coastal ecosystems, impact on tourism and generate significant clean-up costs. The European policy goal, as stated in the Marine Thematic Strategy of the 6th Environment Action Plan is a complete elimination of discharges into the marine environment by 2020. Effective surveillance such as CleanSeaNet is essential if this objective is to be met. However, oil spill detection is not the only area where satellite based SAR surveillance is being applied.

There is growing interest in the use of satellite SAR for fisheries and for maritime border control. In particular, the Integrated Surveillance System for Europe’s southern maritime borders as requested by the European Council is intending to integrate satellite based surveillance with conventional vessel tracking systems.


Chlorophyll-a concentrations
Chlorophyll-a concentrations in the Dutch coast

Routine monitoring of water quality in European coastal areas is important to effectively protect fragile coastal ecosystems. Within the MARCOAST Consortium under the GMES Services Element, most European coastal states are provided with key parameters, including chlorophyll-a concentration, transparency and suspended sediment load, for their region of interest several times per week.

Due to the extensive winter transport levels in the Baltic Sea, Europe hosts the largest volume of commercial shipping activity in ice-infested areas. The timely delivery of accurate, up-to-date sea ice information by national ice services is critical in maintaining the security and efficiency of this transportation. Many national ice services have routinely integrated Envisat and Radarsat SAR imagery into their operational sea ice charts for several years.

These capabilities are based on EO satellites that have already been operating for some time. ESA is working to ensure continuity of the key data streams underpinning these services within the framework of GMES. The Sentinel missions will ensure that SAR, ocean colour, radar altimeter and sea surface temperature observations will be continued beyond the lifetime of the current missions. In addition, ESA is working with the European scientific community to bring new observation techniques, the so called Earth Explorers, to support research in critical Earth science issues such as global change and biodiversity.

ESA welcomes the Integrated Maritime Policy and intends to work with the different actors involved in areas where it sees current or potential future demand for space-based capabilities in the maritime sector.

Tsunami Early Warning Centre inaugurated

Hindu Times Special Correspondent
It will take 30 minutes to analyse the seismic data following an earthquake of more than magnitude 6
— PHOTO: K. RAMESH BABU

MEETING A CHALLENGE: Union Minister for Science and Technology Kapil Sibal at the inauguration of the Tsunami Early Warning System centre in Hyderabad on Monday.

HYDERABAD: A state-of-the-art National Tsunami Early Warning Centre, which has the capability to detect earthquakes of more than 6 magnitude in the Indian Ocean was inaugurated here on Monday by Union Minister for Science & Technology Kapil Sibal. He asked experts to improve the system and further reduce the time for disseminating information to the targeted people.

Lauding various agencies involved in establishing the Rs. 125-crore tsunami warning system without time and cost overruns, he said it was the most modern one in the world. It would now take 30 minutes to analyse the seismic data following an earthquake. The next task was to reduce the time to six to seven minutes, he said. The Centre was set up by the Ministry of Earth Sciences in the Indian National Centre for Ocean Information Services (INCOIS) here.

Mr. Sibal later announced that two more centres of excellence — Joint Marine Meteorological Organisation and Operational Oceanography — would be set up on the INCOIS campus after Chief Minister Y.S. Rajasekhara Reddy instantly agreed to allot 10 acres to the institution.

He said a system was being put in place for collaborating with all neighbouring countries for sharing data. He said four Bottom Pressure Recorders (BPRs) were now deployed in the Bay of Bengal, two in the Arabian Sea and another six would be installed in five to six months. He stressed that technology must be used to provide information to the people through SMS in the local languages.

Real-time network

According to an INCOIS release, the warning system comprises a real-time network of seismic stations, BPRs and 30 tide gauges to detect tsunamigenic earthquakes and monitor tsunamis. The tsumanigenic zones that threaten the Indian Ocean were identified by considering past tsunamis, earthquakes, their magnitudes, and the location of the area relative to a fault and also by tsunami modelling.

The east and west coasts of India and the island regions are likely to be affected by tsunamis generated by earthquakes from two potential sources — the Andaman-Nicobar Sumatra island arc and the Makran subduction zone, north of the Arabian Sea.

Integrated Coastal and Marine Area Management (ICMAM) customised and ran the tsunami model for five ‘historical earthquakes’ and predicted inundation areas. The inundated areas are being overlaid on cadastral level maps of 1:5,000 scale. These community-level inundation maps are extremely useful for assessing the population and infrastructure at risk, the release added. Apart from Dr. Reddy, P.S. Goel, Secretary, Ministry of Earth Sciences, Peter Koltermann, Head, Tsunami Unit, Inter-governmental Oceanographic Commission, and Shailesh Nayak director, INCOIS, spoke.

From the Legal Beagles

Senate hearing on implementing the SAFE Ports Act

The Senate Committee on Homeland Security and Government Affairs conducted an oversight hearing on Implementation of the SAFE Ports Act. The Act assigned approximately 100 maritime security tasks. Mr. Stewart Baker, Department of Homeland Security (DHS), testified that the Department has completed half of the assigned tasks and is on track to complete most of the remainder within the statutory timeframe. He specifically cited the Secure Freight Initiative (SFI), Long-Range Tracking and Identification (LRIT), and Transportation Worker Identification Credential (TWIC) programs as high priority. He also discussed the gap between the pace of technology and the legislative mandates. Mr. Reginald Lloyd, Department of Justice, testified that Project Seahawk in the Port of Charleston has successfully integrated work of the various federal, state, and local agencies. Mr. Stephen Caldwell, Government Accountability Office (GAO), testified that the Department has made significant progress in enhancing maritime security, but that challenges remain, particularly with regard to meeting statutory deadlines. Captain Jeffrey Monroe, City of Portland, Maine, testified that increased emphasis is needed with regard to cargo security. (10/16/07).

Senate hearing on implementing 9/11 Commission recommendations

The Senate Committee on Commerce, Science, and Transportation conducted an oversight hearing on Implementation of the 9/11 Commission Recommendations Act. The focus of this hearing was security in the aviation and surface transportation sectors. Mr. Edmund "Kip" Hawley, Transportation Security Administration (TSA), testified that drafting and implementing regulations is time-consuming. The Department utilizes risk management principles in its security programs, focusing on high-threat, high-consequence events. He mentioned that the TWIC rollout has commenced. Ms. Cathleen Berrick, Government Accountability Office (GAO), testified that the Department has made significant progress in its transportation security efforts, but that many challenges remain. The GAO strongly endorses use of risk management principles with regard to transportation security. (10/16/07).

Weather Note

IAEM Discussion Group:
From the International Data Links Symposium in Washington DC.

TUNISIA: Tunisia: Head of State Gives Instructions to Dispatch Emergency Relief to People in Stricken Areas

Following the exceptional torrential rains that have fallen over the country on Saturday evening and that have affected some of the capital's suburban areas, causing a number of casualties and material damages, President Ben Ali has given instructions to the competent services to closely monitor the situation, while providing emergency relief to the areas concerned. The spokesman for the Presidency of the Republic also announced the cancellation of the ceremony the Head of State was to chair on Monday October 15, on the occasion of the commemoration in Bizerta of Evacuation Day. Search and rescue operations for missing persons, are mostly focusing over the Cebalat Ammar area, north - west of the capital. So far 3 bodies have been found bringing the death toll to 11 people. Civil protection and national guard units are still searching the area, taking advantage of the sunny spell that is affecting the capital this Monday morning.

Bangladesh/India (16 Oct 2007) Monsoon flooding mainly in Bangladesh and parts of India- Reports indicate that 1071 person(s) have been killed and 5000000 have been displaced since late July. Source: http://www.gdacs.org/reports.asp?eventType=FL&ID=129&country=Bangladesh%20India&location=&system=asgard&alertlevel=Red&glide_no=

THAILAND: Northern Thailand is also affected by flooding caused by heavy monsoon rain. Reports indicate that 10 person(s) have been killed and 17000 have been displaced.

KENYA & UGANDA: Ongoing floods because of heavy rains in Kenya and Uganda during the last 61 days have caused a red flood alert. Reports indicate that 52 person(s) have been killed and 340000 have been displaced. It is the heaviest flood in eastern Uganda floods in 35 years which affected 22 districts.

GULF OF MEXICO: Low-pressure system emerged from the Yucatan Peninsula in Mexico into the southwestern Gulf of Mexico and could develop into a tropical cyclone over the next day or two, the U.S. National Hurricane Center said Monday.

Arthur Rabjohn
Visit http://www.iaem.com/regions/iaemeuropa/ and see what we are up to......

RS


Tuesday, October 16, 2007

Time-frequency Study of Nearshore Wind and Wave Processes

Thought I post a wonderful study by my good friend and naval peer, Paul C. Liu..

Paul Liu

Surface wind- gravity waves represent a primary driving force for dynamic processes in the oceans and lakes. As long as wind waves are ubiquitous features on the surfaces of the oceans and lakes, so too are the breaking waves appearing in the form of whitecaps woven in the midst of the wind waves. These waves induce intermittent temporally and spatially energetic mixing events at the sediment-water boundary which affect the redistribution of sediment, heat, and biogeochemical substances (such as nutrients and pollutants). While the importance of surface waves is well recognized, the study of the processes of the surface wind-generated gravity waves appears to have stagnated. At present there seems to be uncertainty as to how to proceed.

We think the there is a need to rethink the basic research approach to wind wave studies. Conventional wind waves studies such as the stationary Gaussian random process, the frequency energy spectrum, and the significant wave height are all based on conceptual frameworks devised over 4 decades ago. These approaches worked quite well for many years in practical applications but they may now be on the verge of obsolescence. Any casual observer looking at the ocean or at lake surfaces cannot possibly conclude that the processes they are seeing are "stationary" by any stretch of imagination. We see it as our challenge to address the non-stationary aspect of the ocean and lake surfaces, and to re-think the earlier approach of relying on frequency spectrum. We seek a fresh and novel new approach and ideas for surface wind wave studies.

Collaborators
Alexander V. Babanin, Swinburne University of Technology,
Australia (Swineburne University web site)
Chen H. Tsai, National Taiwan Ocean University, Keelung, Taiwan (National Taiwan Ocean University web site)

2006 Plans

In spite of the fact that breaking waves are integral components of the wind wave system, they have been largely ignored in wave modeling development and general studies. Most of the vast amounts of the available time series data of wind waves undoubtedly contain breaking waves, nevertheless most of the conventional study of wave modeling and wave data analysis based on theses time series recordings were performed as if the breaking waves were entirely absent. An early attempt (Liu in Annales Geophysicae, 1993) used continuous wavelet transform and the complex valued Morlet wavelet to estimate local surface acceleration and thereby detect wave breaking events through a given limiting fraction of gravitational acceleration. The approach remained idle until we meet Alex Babanin who has just the kind of breaking wave field measurements that can be used to test and substantiate our 1993 proposition. This collaborative work has been making encouraging progress. Additionally, we recently were able to acquire 5 GB of continuously recorded high quality time series wave data from western Pacific Ocean northeast of Taiwan from Prof. C. H. Tsai of National Taiwan Ocean University. We wish to continue these collaborations on breaking wave field measurements.

Program Accomplishments

We have been involved in wind wave studies since 1998. We have experimented with a number of different research approaches and worked with data from a variety of instrumentation deployed in Lake Michigan over this timeframe including Acoustic Doppler Current ProfilersADCP's), waveriders, tripods equipped with: pressure sensor, current meter, thermistor, and a transmissometercurrent meters. Beginning in summer of 2003 we shifted our research effort externally available wave data. We are now studying the detection of breaking waves in the time series using Wavelet Transform in collaboration with Alex Babanin. Additionally, are collaborating with C. H. Tsai studying continuously recorded high quality time series wave data from western Pacific Ocean northeast of Taiwan. (

In 2003 started by analyzing the new wave data recorded by the two bottomed-mounted, upward-looking Acoustic Doppler Current Profiler (ADCP) deployed in eastern Lake Michigan in the late autumn of 2002. The two gages were deployed at depths of 20 m and 12 m. From the middle of October to the beginning of December, over 40 days of continuous, non-intermittent wave measurements were collected. As ADCP's are well known for current measurements, wave measurement is their developed function. While the wave measurements have been quite successful, we found, at some unknown and difficult to trace frequencies the surface recording tends to become noisy. So while it provides reasonable general wave conditions we are not yet able to work with its time series data. In the later part of the year we shifted our effort to study the detection of breaking waves in the time series using Wavelet Transform in collaboration with Alex Babanin of the University of Adelaide of Australia who has breaking wave measurements from Lake George and Black Sea.

Prior to 2003 we focused on an analysis of the data collected from this instrumentation during the field seasons of 1998-2000. The effort concentrated on determining the differences between the wave parameters derived from the observations and those calculated by the GLERL-Donelan wave model. The wave model tends to under estimate the wave periods, so the bottom stresses calculated from the model results are usually less than those derived from the observations. This may be important when analyzing the results at a specific site, but for lake-wide models other sources of error are probably more important. The present sediment resuspension model is being modified to calculate the shear stress in order to model the measured results from the 18 deployments in Lake Michigan conducted over the last few years. No more sediment resuspension study will be done in this program.

deployment of   wave rider buoy

Deployment of Waverider buoy

The Waverider and two other moorings were deployed near Muskegon in the spring of 2000 to collect simultaneous surface measurements and water pressure measurements of wave heights. Analysis of the 1998-1999 data has proceeded continuously. The data show that the occurrence of waves with periods greater than 8 seconds is more frequent than previously thought, and that the present wave model does not accurately calculate the wave periods. Further analysis on applying the time-frequency wavelet spectrum analysis leads to new approach of identifying wave groups in each of the measured time series and defining relevant empirical wave group dimensional parameters. The results led to two normalized non-dimensional wave group parameters through classic dimensional analysis that provided new perspectives on wave grouping characteristics.

In 1998-99 an essentially complete time series records of wave parameters were obtained from the moorings at Michigan City, Benton Harbor, and Milwaukee. A complete time series record of water transparency was collected at the Milwaukee mooring and a partial one from Michigan City. In addition, measurements of water transparency and water temperature were obtained from 8 water intake plants. .

In 1998, an instrumented NDBC buoy 45011 was deployed in 1997 in the eastern Lake Michigan nearshore area near Grand Haven, Michigan at 43.02N and 86.27W. A number of interesting wave growth episodes were recorded. Besides research use of the measured data, the availability of lake meteorological information in the nearshore area has also received appreciative and favorable comments from nearshore lake users. In 1998, however, because of funding shortage the NDBC buoy measurement had been discontinued. Instead we chose to explore making underwater pressure sensor measurements of surface waves during the winter season.

In preparation of the instrument deployment, one tripod was modified to collect time series wave data and deployed in June and July of 1998. The test development was successful and three other tripods were modified prior to deployment in October.

Five moorings were deployed in October and November of 1998. Four of these (located near Milwaukee, Muskegon, Benton Harbor, and Michigan City) are tripods equipped with a pressure sensor, a current meter, a thermistor, and a transmissometer. The 5th mooring is an acoustic current meter, located near Muskegon to provide observations of the near bottom wave orbital velocities.

Milestone Reports

FY 2001 Q3 Milestone Report Complete the preliminary assessment of the wave grouping effects in nearshore Lake Michigan.

FY 1997 Q4 Milestone Report Completion of the Lake Michigan near shore hydrodynamic study of the Milwaukee area and reporting on wind and wave time series data analysis.

Products

Liu, P.C., D.J. Schwab, and J.R. Bennett. 2005. Some perspectives of the GLERL/DonelanDonelan Wave Symposium, University of Miami monograph. (In press) wave model, in

Lin, A. B. and P. C. Liu, 2004. Wavelet based comparison of infrared and water vapor images. Far East Journal of Applied Mathematics. 17(3), 309-326.

Liu, P. C., and B. V. Babanin. Using wavelet spectrum analysis to resolve breaking events in the wind wave time series. Annales Geophysicae 22:3335-3345 (2004). http://www.glerl.noaa.gov/pubs/fulltext/2004/20040024.pdf

Liu, P.C. and N. Hawley. 2002. Wave grouping characteristics in nearshore Great Lakes, Part II, Ocean Engineering, 29, 1415-1425.

Liu, P.C., editor, 1997. Nearshore Hydrodynamics Studies in Western Lake Michigan. NOAAGLERL-103, Great Lakes Environmental Research Laboratory, (NTIS# PB97-211031INZ) 40 pp. Technical Memorandum ERL

Maritime Notes

From Cargolaw

On June 22 2007 the 24 crew of M/V Denden began a 20 hour ordeal off the Thannirbhavi coast, about 13 km from Managalore, India. The vessel had departed New Mangalore Port, making for Dubai with a cargo of furnace oil slag when her engines failed off Panambur Beach. High velocity winds from Cyclone Gonu pushed M/V Denden towards the land.

Cyclone Gonu was the strongest tropical cyclone on record in the Arabian Sea, and tied for the strongest tropical cyclone on record in the northern Indian Ocean.

This would be the first casualty experience during the distinguished 40-years career at sea for Capt. Abraham Kwaw.

The entire crew would be tested. All would be heroes. Some would be lost in the wake of Cyclone Gonu. Cyclone Gonu.

Michael S. McDaniel - Your Editor

Flag from the Bridge

This dramatic photo of the M/V Denden is just incredible from a seaman's point of view. The vessel itself was a total loss due to the Cyclone. Mother nature can be a witch when she wants to. 2 died 14 rescued.

RS